Improving PROTAC properties via single-point changes to linkers
We explore how computational methods can be applied to proteolysis targeting chimera (PROTAC) design, to effectively tackle some of the ...
News
Giovanna Tedesco
Cresset, New Cambridge House, Bassingbourn Road, Litlington, Cambridgeshire, SG8 0SS, UK
Activity Atlas1 is a novel, qualitative method available in Forge2, Cresset’s powerful workbench for ligand design and SAR analysis. Activity Atlas is particularly useful to condense large data tables into a single picture, summarizing structure-activity data into highly visual 3D maps that inform the design and optimization of new compounds. In this case study, Activity Atlas was used to analyze the Structure-Activity Relationships (SAR) of a large data set of Orexin 2 receptor ligands taken from the US patent literature, with the objective to quickly investigate and understand the electrostatic, hydrophobic and shape features underlying the receptor activity of a recently published scaffold.
Whenever a new research project is initiated, or transferred across teams, familiarization with the prior art for the project must be completed in the shortest possible time so as to avoid wasting resources investing in directions already explored in the past. Equally, new patent publications on a project of current interest can inform optimization decisions on an in house series.
Historical information, both in house and published, is often available in electronic format, however, exploring the known SAR for a target can be a tedious and time consuming exercise for the project team because of the volume of data implied.
Activity Atlas is a probabilistic method of analyzing the SAR of a set of aligned compounds as a function of their electrostatic, hydrophobic and shape properties. The method uses a Bayesian approach to take a global view of the data in a qualitative manner. Results are displayed using Forge’s visualization capabilities to gain a better understanding of the features which underlie the SAR of your compounds.
In this case study, the activity cliff summary method in Activity Atlas was used to find the critical SAR regions of a large data set of published Orexin 2 Receptor ligands. The objective was to understand the electrostatic, hydrophobic and shape features underlying receptor activity and to demonstrate the applicability of this method to the SAR analysis of large data sets.
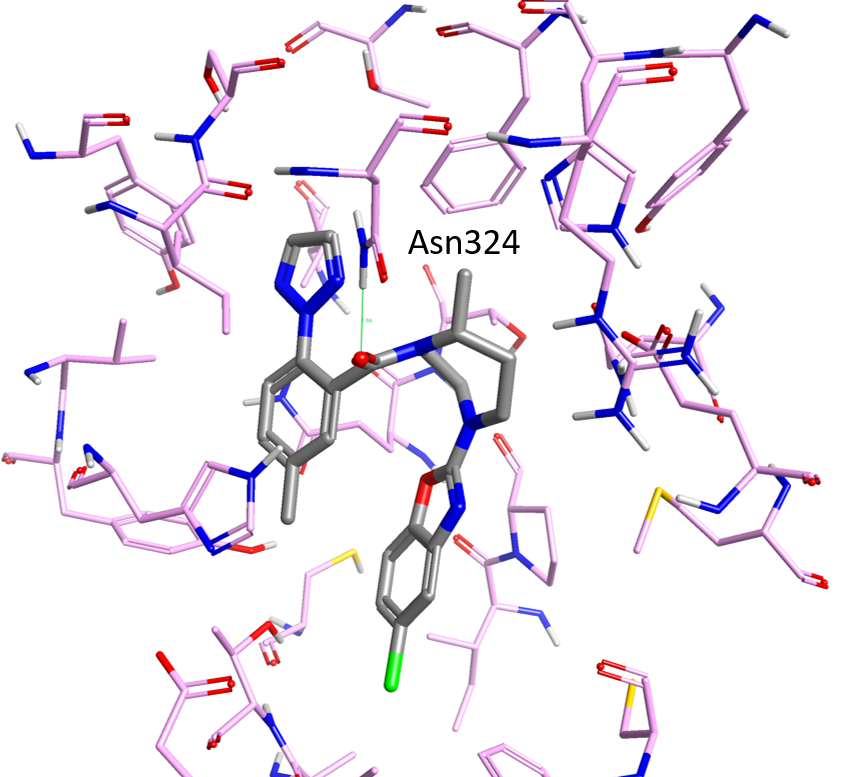
The Orexin system is composed of two widely expressed G-protein coupled receptors: Orexin 1 and Orexin 2 receptors (OX1R and OX2R, respectively), which respond to two peptide agonists (orexin-A and orexin-B) in the central nervous system to regulate sleep and other behavioral functions in humans3. The structure of Suvorexant4 (potent therapeutic inhibitor of the Orexin system) bound to human OX2R was recently solved5 at 2.5Å resolution. The X-ray structure (Figure 1) reveals how Suvorexant binds to OX2R adopting a pi-stacked horseshoe-like conformation deep in the orthosteric pocket, stabilizing a network of extracellular salt bridges and blocking transmembrane helix motions necessary for activation. Most of the ligand contacts involve van der Waals interactions or aromatic packing. Suvorexant’s tertiary amide carbonyl forms a strong hydrogen bond with Asn324 (Figure 1) and only a few other direct polar interactions with the OX2R binding site. Several water-mediated hydrogen bonds form bridges between Suvorexant and polar amino acids such as Asn324 and His350.
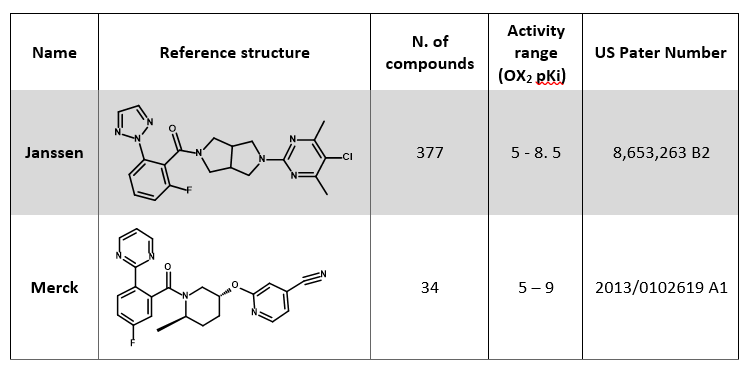
A large data set of approximately 400 compounds with available OX2R data (expressed as nM Ki) gathered from the ‘US patent’ data source was downloaded from BindingDB.6 These records cover patent information published between 2013 and 2014 by Janssen7 and Merck8.
The set is composed of two main chemical series: for both, the most potent compound was selected as a reference structure for that series (Table 1).
The two reference compounds in Table 1 were aligned to the published X-ray crystal structure of Suvorexant (PDB 4S0V) by field-based alignment within Forge following a ‘very accurate but slow’ conformation hunt:
The 400 compounds in the data set were then aligned to the appropriate reference structure by maximum common substructure alignment following an ‘accurate but slow’ set-up for the conformation hunt:
‘Permissive’ maximum common substructure matching rules (in which substructure matches ignore element but take into account hybridization, so that for example cyclohexane matches morpholine but not benzene) were used for the alignment.
Activity Atlas models are calculated following a probabilistic approach which takes into account the probability that a molecule is correctly aligned, rather than assuming that the top scoring or the selected preferred alignment is the correct alignment.
This is done by associating a weight with each alignment based on its similarity score. Alignments with similarity higher than a certain threshold (which can either be automatically calculated by Forge, or manually defined by the user) are fully trusted. Alignments with similarity lower than the low similarity threshold are not trusted and discarded. Linear scaling is applied to associate a proper weight to alignments which have an intermediate similarity score.
Likewise, a weight is also associated with each molecule based on its activity. Molecules whose activity is higher than a certain threshold (which again can either be automatically calculated by Forge, or manually defined by the user) are considered fully active. Molecules whose activity is lower than the low activity threshold are considered inactive. Molecules with intermediate activity are considered only partially active.
Activity Atlas calculates and displays as 3D visualizations the:
The regions explored analysis also calculates a novelty score for each molecule.
In this case study, the activity cliff summary analysis was applied to both series with the objective of interpreting and understanding their SAR.
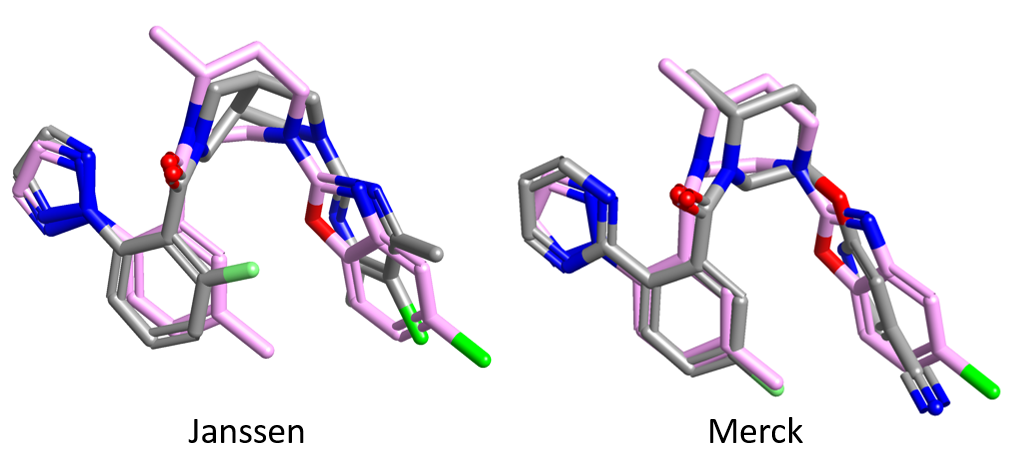
Figure 2 shows the two reference compounds (grey) in Table 1 superimposed to the crystal structure of Suvorexant (pink) bound to the OX2 receptor. Both the Jannsen and the Merck compounds superimpose very well with Suvorexant, with the tertiary amide carbonyl pointing towards Asn324 (which makes a hydrogen bond interaction with the corresponding carbonyl in Suvorexant). This may indicate a common binding mode for the two series of compounds.
The Janssen data set consists of 377 compounds spanning an OX2R pKi range from 5 to 8. 5.
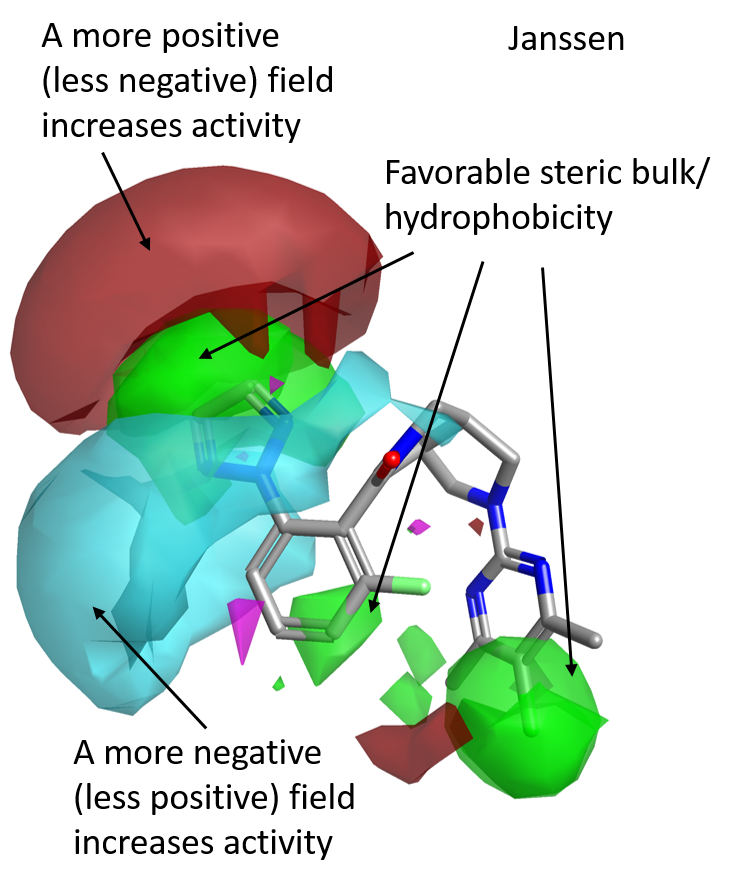
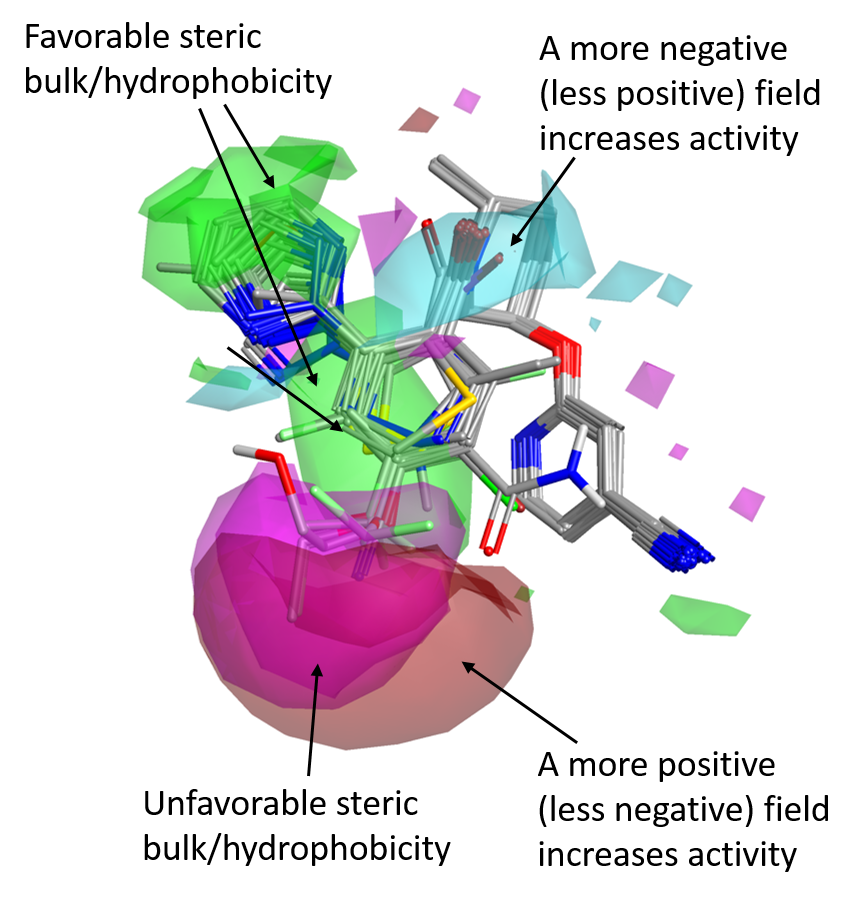
The activity cliff summary analysis for this data set indicates that OX2R activity is increased by having a hydrophobic substituent on the ortho position of the left side phenyl ring, as shown by the favorable (green) areas in Figure 3.
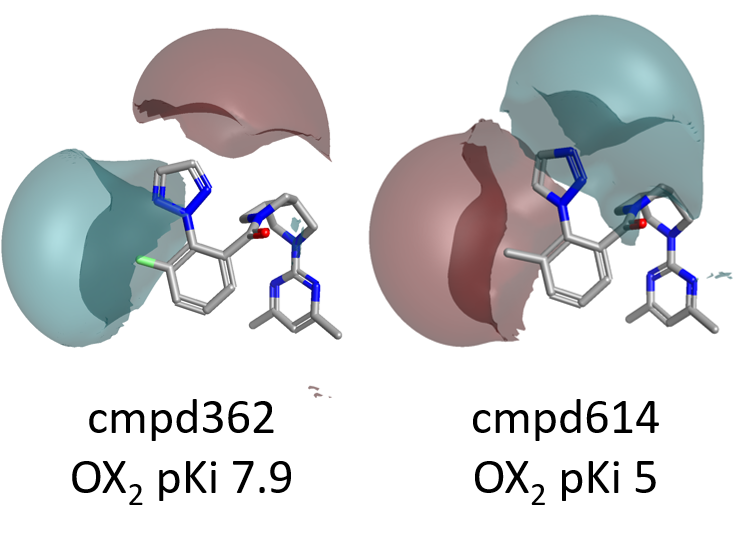
The preferred decorations on this ring are characterized by a stronger positive (red) field at the edge of the ortho substituent, as well as by a stronger negative (cyan) field wrapping the meta and ortho substituents above and below the plane of the molecule.
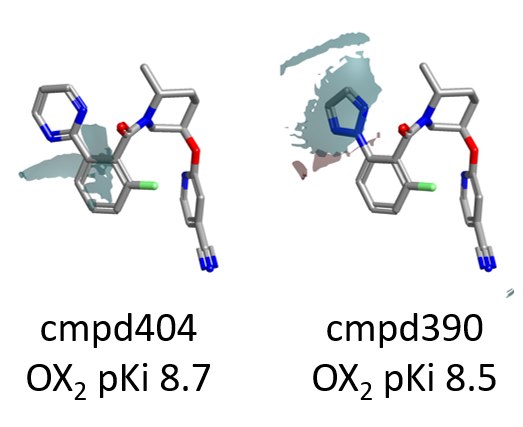
As shown in Figure 4, large differences in the electrostatic fields surrounding the left side of the molecule are associated with dramatic changes in OX2R pKi.
Accordingly, the choice of an appropriate heterocycle and electronegative groups such as small halogens for the decoration of the left side phenyl ring, which help creating the right pattern of positive and negative electrostatic fields around the molecule, is crucial for modulating OX2R activity.
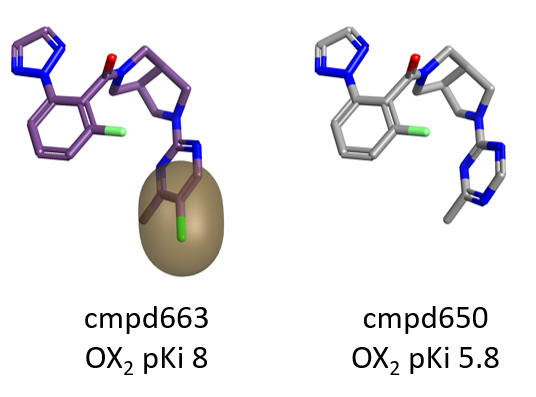
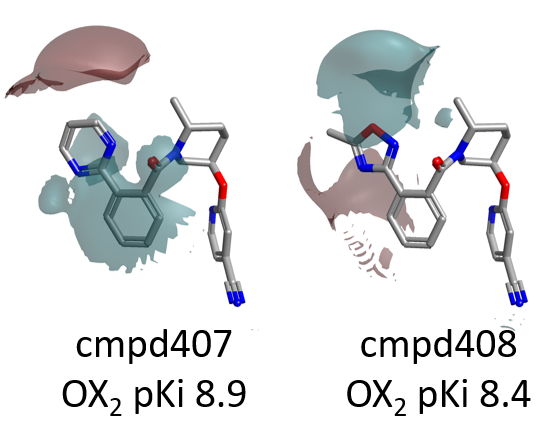
Steric bulk and hydrophobicity on the para position of the pyrimidine ring on the right side of the molecule are also beneficial for OX2R, as shown by the green areas in Figure 3.
Also in this case the choice of an appropriate decoration can have a dramatic impact on pKi, as shown in Figure 5 below.
This is surprising, given the excellent fit to Suvorexant of both the Janssen and the Merck reference structures (Figure 2), which seems to indicate a common binding more for the two series.
As for the SAR of the left side phenyl ring, the favorable positive and negative field areas associated with the ortho and meta substituents in the Janssen data set no longer appear, even though steric bulk/hydrophobicity in this position are still favorable (green areas).
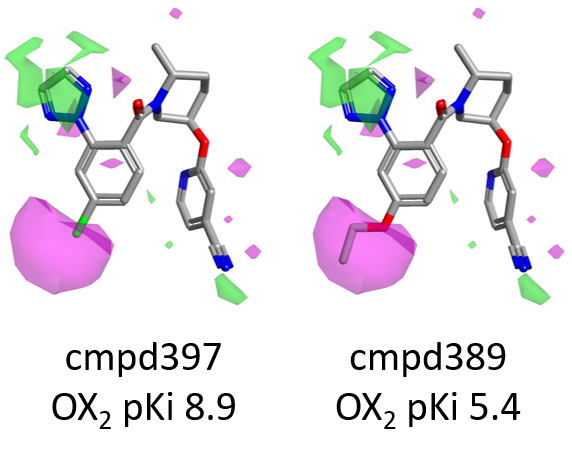
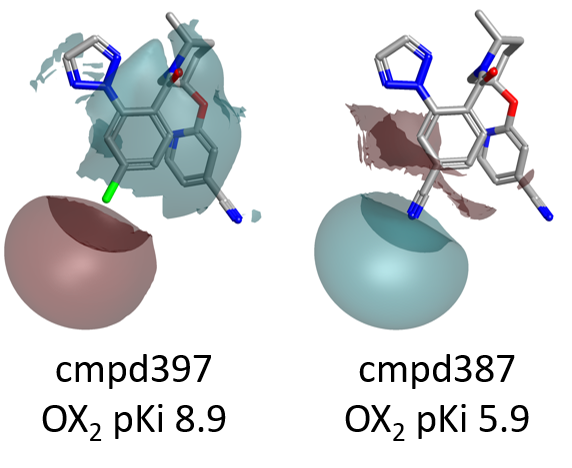
There is instead a strong signal related to the para position. Bulky substituents in para are detrimental for OX2R activity (magenta areas), while those associated to a stronger positive (or weaker negative) field, shown in red, are beneficial for activity.
For example, as shown in Figure 7 below, compound 397 (para-Cl) is more active than 389, carrying a bulkier OEt which enters into the area of unfavorable (magenta) shape.
Going back to the activity cliff summary maps in Figure 6, the lack of SAR on the right side pyridine is to be expected, as this substituent does not vary across the data set.
The favorable negative field area associated with the tertiary amide carbonyl of the Merck compounds is consistent with the fact that in Suvorexant bound to OX2R this carbonyl makes an H-bond interaction with Asn324. Assuming a similar binding mode for the Merck compounds, decorations on the left side of the molecule which strengthen the negative field associated with the C=O are should be beneficial for activity.
Activity Atlas is a new method for summarizing the SAR for a series into a visual 3D model that can be used to inform new molecule design. In this case study, Activity Atlas proved to be an invaluable tool for quickly summarizing, analyzing and understanding the SAR of a large collection of compounds gathered from US patent information.
In particular, the Activity Atlas activity cliff summaries highlighted in quick and highly visual manner both the commonalities across the series and the dissimilarities in SAR potentially related to minor changes in the binding mode.
Both represent important information for deciding future directions for the project: the commonalities potentially highlighting areas of chemical exploration so far unexploited; while the dissimilarities may offer a way of further refining the overall profile of the chemical series of interest.
1. http://www.cresset-group.com/activity-atlas/
2. http://www.cresset-group.com/products/forge/
3. Li, J., et al., Br. J. Pharmacol. 171, 332-350 (2014)
4. Winrow, C.J., et al., Br. J. Pharmacol. 171, 283-293 (2014)
5. Yin, J., et al., Nature 519, 247-250 (2015)
6. https://www.bindingdb.org
7. US Patent 8,653,263 B2
8. US Patent 2013/0102619 A1