Improving PROTAC properties via single-point changes to linkers
We explore how computational methods can be applied to proteolysis targeting chimera (PROTAC) design, to effectively tackle some of the ...
News
Ion channels are dynamic proteins, complex molecular machines and notoriously difficult targets to conduct medicinal chemistry on. Partly this is due to complexity but also the absence of detailed structural knowledge. Huge advances in ion channel assay techniques and cryoelectron microscopy are rapidly increasing our knowledge of both detailed ion channel structure
gating mechanisms and how ligands interact with the different sites and states within ion channels.
However, at present there are very few solved structures which contain ligands. As a result, computational modeling techniques (Figure 1), including both structure and ligandcentric methods, are still key for understanding SAR around positive and negative potentiators of ion channel currents.
One of the most useful techniques for examining activity in a ligand-based context is 3D similarity. In particular, aligning molecules based on electrostatic and shape similarity and analysing the alignment can provide much information about the features required for activity. QSAR methods can often fail to find good linear models of this data, however, so there is a need for more robust information extraction techniques. Cresset has recently released Activity Atlas1 , a new and highly efficient method to extract key insights from noisy assay data. Activity Atlas uses a Bayesian approach to ascertain which steric and electronic properties of the ligands seem to correlate with higher activity.
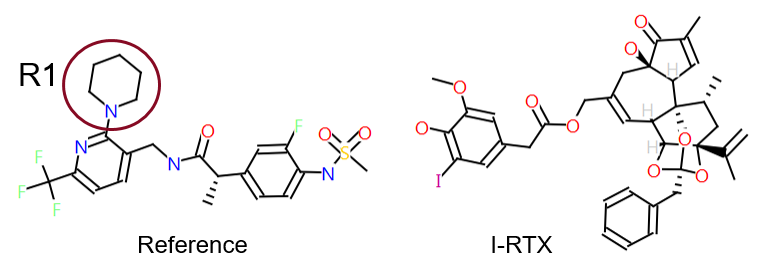
To illustrate the point, we extracted a set of 91 literature2 TRPV1 antagonists for which a specific R-group replacement exercise had been performed. These were analyzed in the context of a channel bound conformation. The TRPV1 X-ray data (Figure 1) with resiniferatoxin (RTX)3 bound was used as a starting point for deriving a reasonable hypothesis for the synthetic antagonist conformation. The SAR was then aligned in 3D to this reference. The data associated with the compounds comprised two assays: Ki for inhibition of capsaicin induced activation and IC50 for pH induced activation of TRPV1 channels (Figure 2).

Figure 2. Ki and IC50 for inhibition of capsaicin and pH induced activation for a set of TRPV1 antagonists. Box: Shows a set of example ligands which have a disparity across the two assays, whilst on the whole the correlation is reasonable for the majority of the set.
Box: Shows a set of example ligands which have a disparity across the two assays, whilst on the whole the correlation is reasonable for the majority of the set.
Activity Atlas is an alternative approach which uses pairwise 3D comparisons through a data set to extract information. The application of Activity Atlas to this data set is shown in Figures 3 & 4.
Where a pair of example compounds are similar, from a shape and electrostatic sense, but have a different activity (a 3D activity cliff), this technique qualitatively shows where in 3D space those differences are manifested. Repeated across the 3D alignment set, the resultant composite picture produces a summary of where the favorable electrostatics are across the 3D alignment set. The same approach is used for atomic sterics to give the mappings shown in Figure 4.
The output from this analysis identifies some differential properties from the two data sets which could not have been extracted otherwise – mainly in the steric contributions. There is steric restraint on substitution on one side of the piperidine which appears to be more important in the pH induced TRPV1. An interpretation of this is that there is a difference in protein conformation around the binding site, in capsaicin induced activation relative to pH induced activation. This affects the ligand interaction depending on which specific parts of the inhibitor structure are making contact. In addition to the pairwise analyses a view across actives is also provided and also a depiction of ‘where’ we have been in the SAR exploration (Figure 5) for a more global picture of what are important features for the active ligands.
Figure 3. Activity Atlas output from Forge4: electrostatic summary (red: positive good, blue: negative good) for IC50 [pH] (right) and Ki [Cap] (left).
Figure 4. Activity Atlas output from Forge: steric activity cliff summary (pink: bad, green: good) for IC50 [pH] (right) and Ki [Cap] (left).
Figure 5. Activity Atlas output – 3D summary of actives (left) and full data set 3D summary. Colours as previously apart from white: shape.
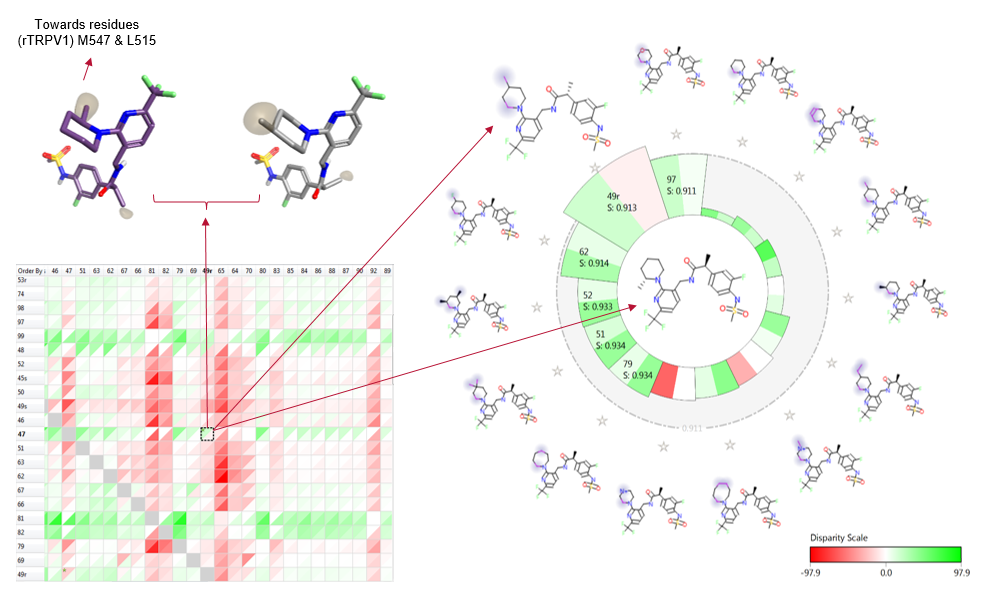
Activity Miner5 is a further component of Forge allowing focused extraction of individual activity and selectivity cliff examples: For an aligned data set, the all-by-all matrix can be displayed so that for any given pair, cliffs involving increases in activity are colored ‘green’ and decrease ‘red’. This is then a very rapid way of picking out key SAR.
Figure 6 includes one of four structurally related compounds (boxed in figure 2) which suggest that there is a real effect that could have implications in the design of future ligands, potentially with stimulus tuned activities.

Figure 6. Activity cliff matrix (bottom left); alignment pair in 3D (top left), and activity view (right) of the most 3D similar examples to the central ligand (decreasing similarity clockwise). For this data set both biological activities are represented and a differentiation between the two is clearly highlighted where there are different colored wedges in the same cell.
Where data is insufficient in terms of quality or number for predictive models, it is still possible to provide useful insights from the qualitative visualization provided by Activity Atlas and Activity Miner. Powerful, yet simple to use techniques for 3D-SAR analysis; capable of extracting useful non-intuitive insights from ligand activity data. In this case a steric constraint was identified which may explain the differential activity of this TRPV1 data set in two assays.
1. http://www.cresset-group.com/activity-atlas
2. J Med Chem. 2012 October 11; 55(19): 8392–8408
3. Winter et al. Molecular Pain 2013, 9:30