flare™
Activity Atlas™
Qualitative SAR insights from novel methods
Visualize and understand SAR in a single picture
A component of Flare, Activity Atlas is a novel method that works the way you do. Working from 3D aligned structures it compares each pair of ligands to understand what changed and how did this affect the activity. The results are displayed as a 3D qualitative model of the SAR landscape around your molecules. It enables you to focus on important SAR signals and to identify unexplored regions to solve key problems in the project.
Activity Atlas has multiple read outs that inform and guide project progression:
- ‘Activity Cliff Summary’: What do the activity cliffs tell us about the SAR?
- ‘Average of actives’: What do active molecules have in common?
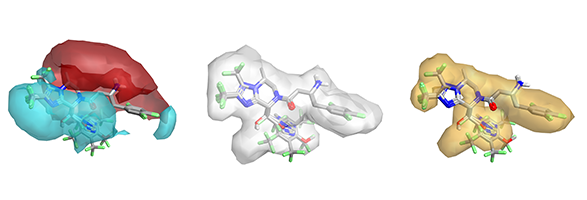
- ‘Regions explored’: Where have I been? For a new molecule, would making it increase our understanding? This analysis also calculates a novelty score for each molecule.
Activity Cliff Summary
Activity cliffs highlight the most acute regions of SAR. Activity Atlas combines the activity cliffs from all pairwise comparisons of molecules in your data set into a 3D model that highlights and summarizes the SAR. Unique and insightful, the activity cliff summary has become a regular feature in publications and project team meetings across drug discovery chemistry. Use the activity cliff summary in Activity Atlas models to:
- Visualize the SAR of small or large datasets in a single picture
- Identify hidden SAR trends using electrostatics
- Validate new molecule designs against existing SAR
'Average of actives' analysis
The average of actives analysis brings all the features of active molecules into a single representation. Where a single active molecule has a very detailed electrostatic pattern, the average of actives brings a higher level distillation of the information, down-weighting features that are less important to activity. The primary use of the average of actives analysis is in the design of new molecules to ensure that no SAR is forgotten and that each new molecule has as many of the important features as possible.
‘Regions explored’ analysis
The third and final Activity Atlas model is similar to the Average of Actives analysis, but disregards biological activity completely. Its objective is to make an assessment of what regions of the aligned molecules have been fully explored: it tells you where you have already been with your project. This analysis can be used in a predictive sense. You can map proposed molecules against it to see whether the new molecules take you into new regions, or only send you to places that you have been before.

Regions already explored for electrostatics (left), shape (center), hydrophobics (right).