Improving PROTAC properties via single-point changes to linkers
We explore how computational methods can be applied to proteolysis targeting chimera (PROTAC) design, to effectively tackle some of the ...
News
We have been looking at ways to improve the navigation of structure activity relationship data. In Forge we have the capability to create a quantitative relationship between the molecular fields and the activity, but this is a time-consuming task that is not always successful. We wanted to add both automated and manual methods to extract qualitative SAR information from your data. With this in mind we have created ‘Activity Miner’ to rapidly interrogate and decipher SAR in both Torch and Forge. This will be part of a larger set of SAR interpretation tools that we hope to release over the coming months.
Activity Miner starts from a set of aligned molecules and compares them to each other. Each pair is given a ‘disparity’ value which reflects how much the activity changes relative to the structure. Pairs with high disparity (activity cliffs) contain more information about your SAR. By looking at all the high disparity pairs you can rapidly navigate through your dataset and understand where key changes have been made to your molecules.
Importantly changes to the structure can be judged either using classical 2D fingerprints or more intriguingly using Cresset’s molecular fields. Using fields gives similarities that are sensitive to the electrostatic and shape changes that are being made. Additionally, using fields provides the capability to compare pairs of structurally diverse compounds, although we expect this feature to be most useful within one chemical series.
Within Activity Miner, the notion of ‘disparity’ is the key element used to investigate the activity landscape.
Disparity is calculated by dividing the difference in activity between two molecules by the distance between them. In Activity Miner the distance is calculated as ‘1 – similarity’ where similarity is either Cresset’s field similarity or the 2-D similarity. Pairs of molecules that have large differences in activity while having good field similarity give high disparities and highlight important aspects of the SAR.
For those of us who want to think through the mathematics: Disparity is given by:
Activity Miner presents the disparity data between pairs of molecules together with the 3D view of the molecules to enable you to easily visualise what structural and field changes are contributing to an activity change (below).
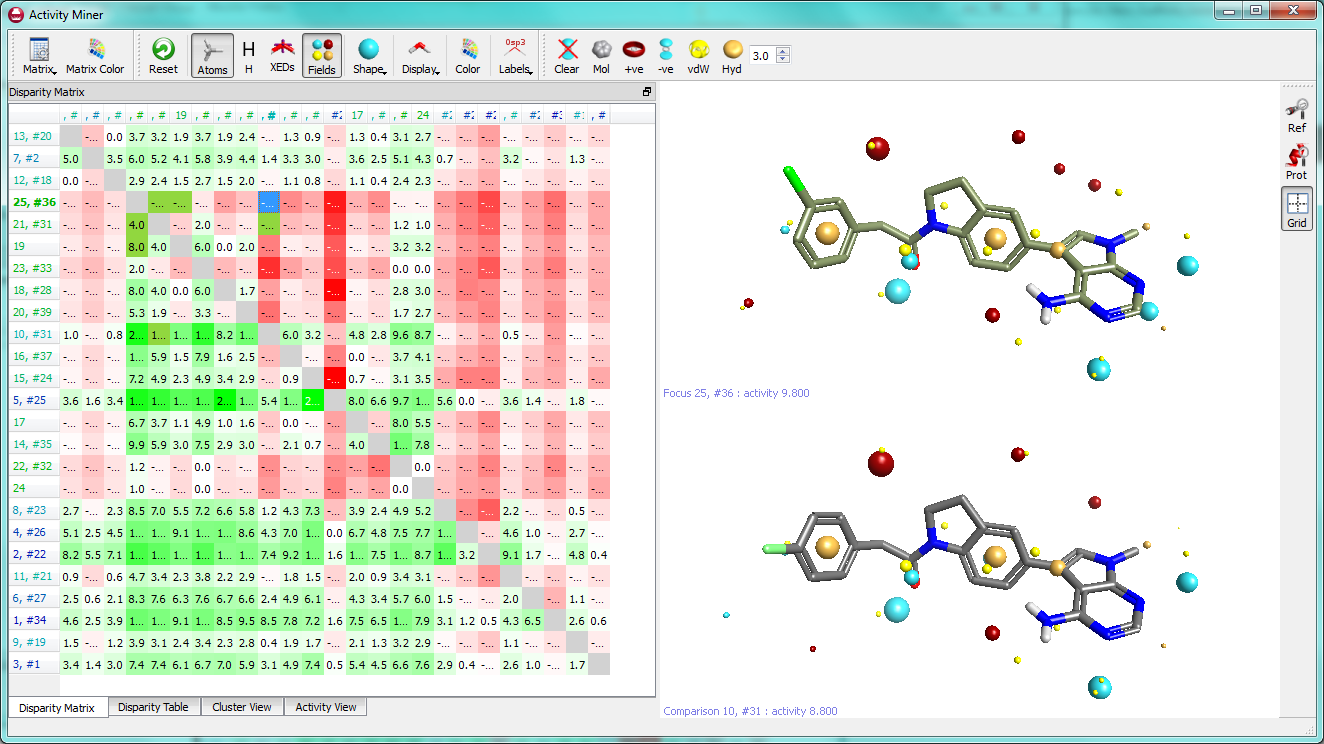
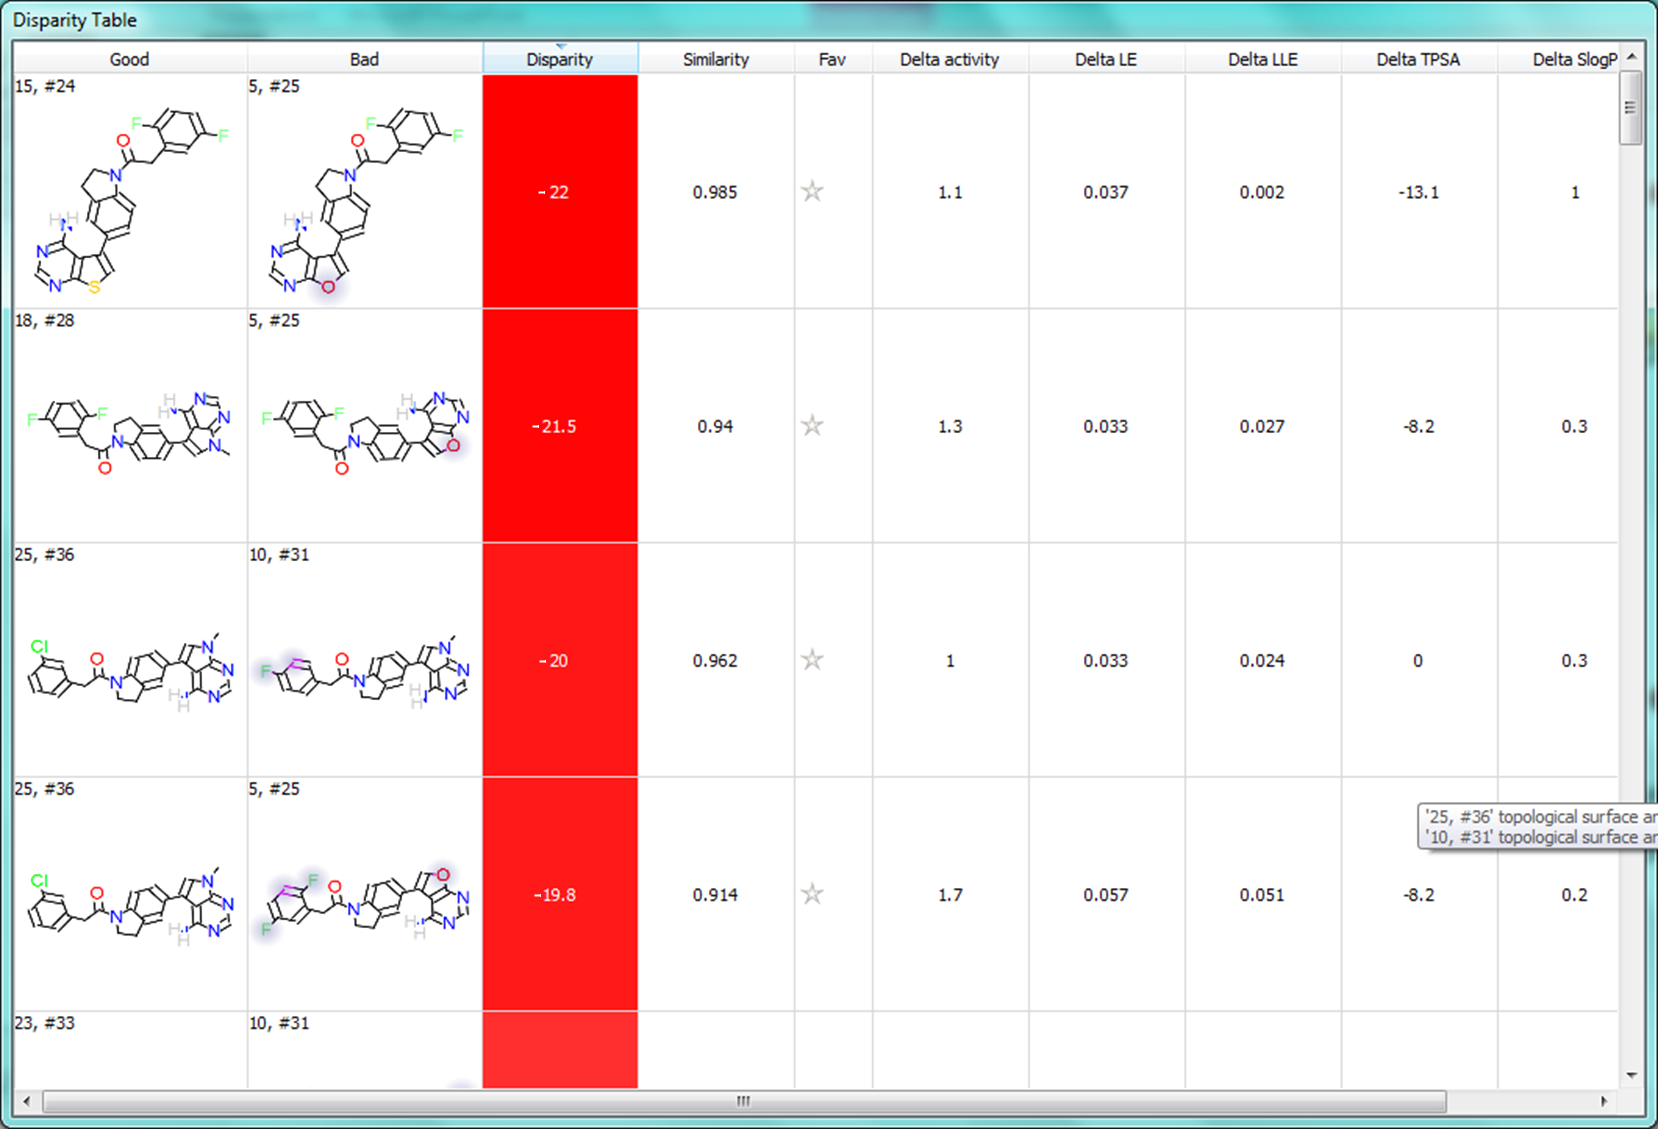
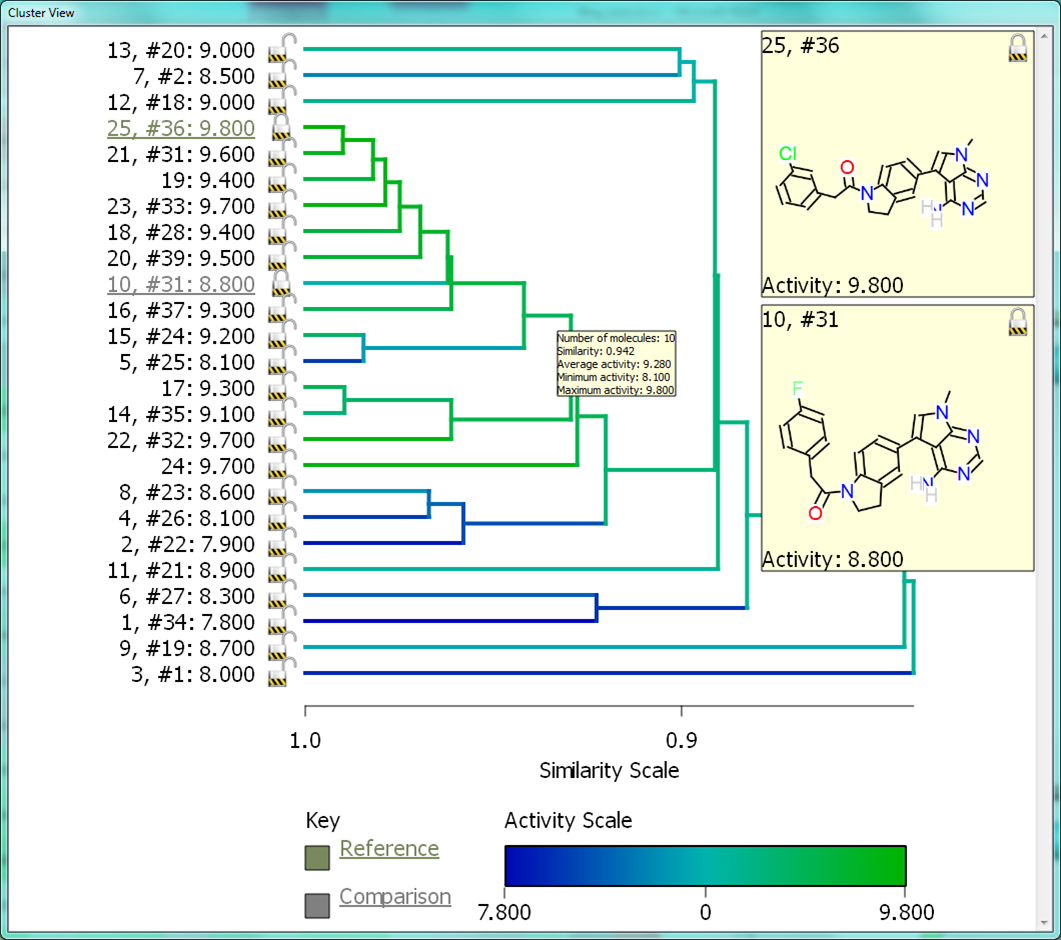
We will examine the GSK PERK dataset (J. Med. Chem, 2012, 55, 7193) that we discussed in the April blog and employ Activity Miner to look for interesting structure-activity correlations. To do this we took our aligned dataset of compounds (they were aligned using the ‘Substructure’ method in Torch) and sent the alignments into the new Activity Miner module.
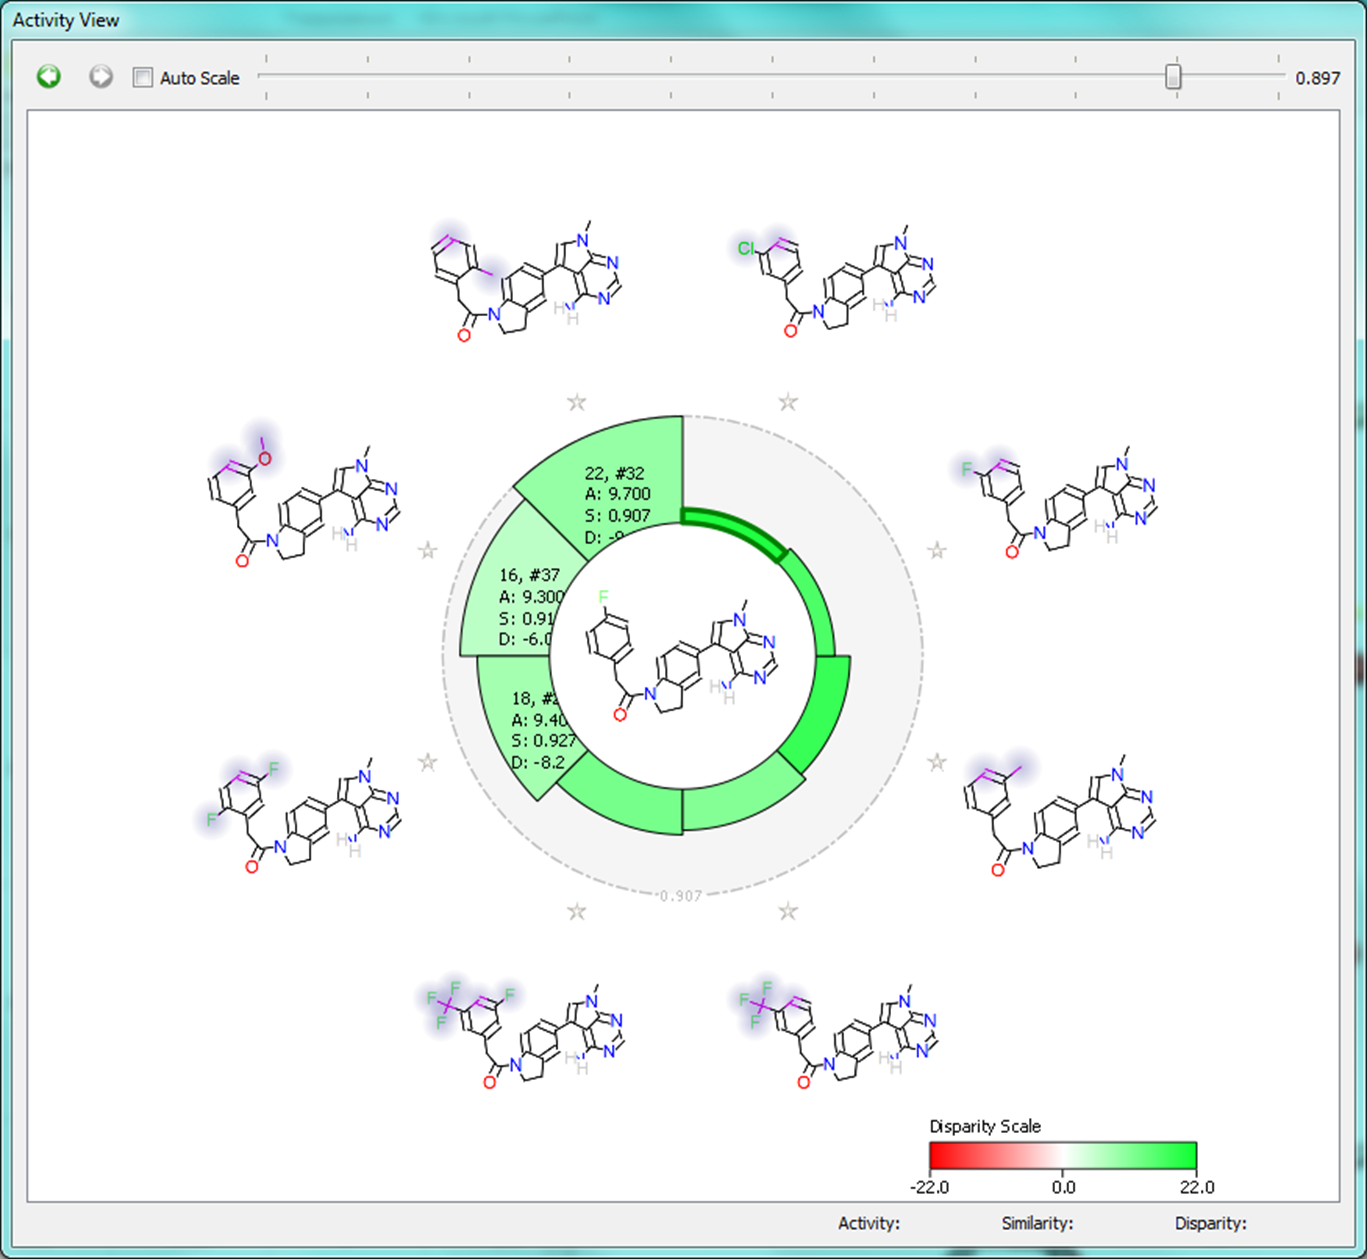
The Activity View shows a selected ‘focus’ compound in the center, with the neighboring molecules around the circumference. The color-coding and height of the ‘boxes’ provide quick visualization of the distance between molecules and their disparity with smaller boxes reflecting smaller distances (more similar), and darker colors referring to higher disparity. Green corresponds to positive disparity; red corresponds to negative disparity. For this example comparison, we chose molecule ’10, #31′ as the focus (pIC50=8.8). The Activity view for this molecule is shown below (left).
Now we compare it molecule ’25’ (pIC50=9.8) from the PERK dataset. This compound has the highest field similarity to the focus compound (0.98), and the highest disparity. If we click on the segment next to this compound it grows to show the associated data (see animation below).
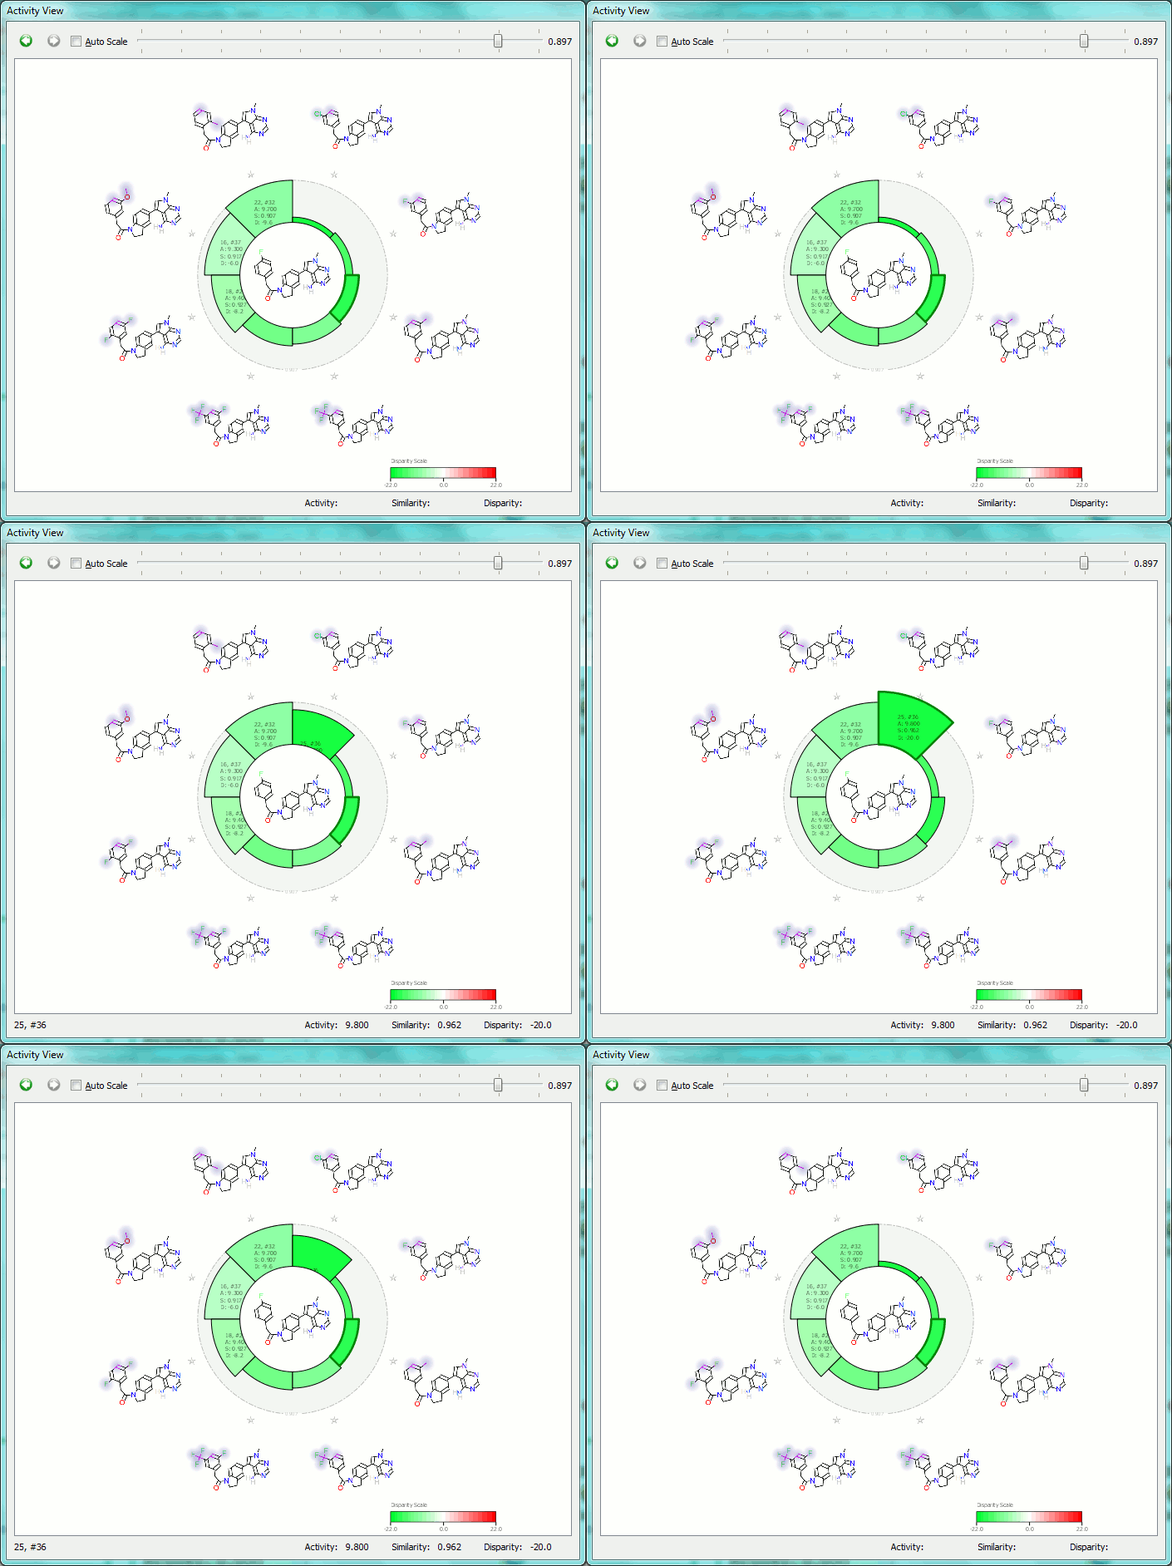
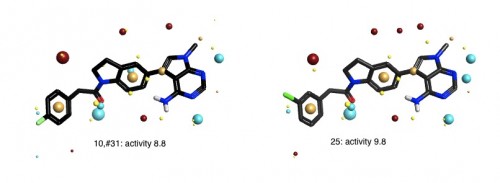
This first example illustrates how the relevant SAR can easily be extracted from even a large data set, showing at a glance the most important changes you have made.
In mining the SAR landscape for an understanding of what factors drive activity, we need to be able to think about molecular changes in terms of their effects on the electrostatics and shape, not just the structure. For example, we can look at aromatic substitutions both in terms of the properties of the substituent and in terms of the effect of the substituent on the pi system.
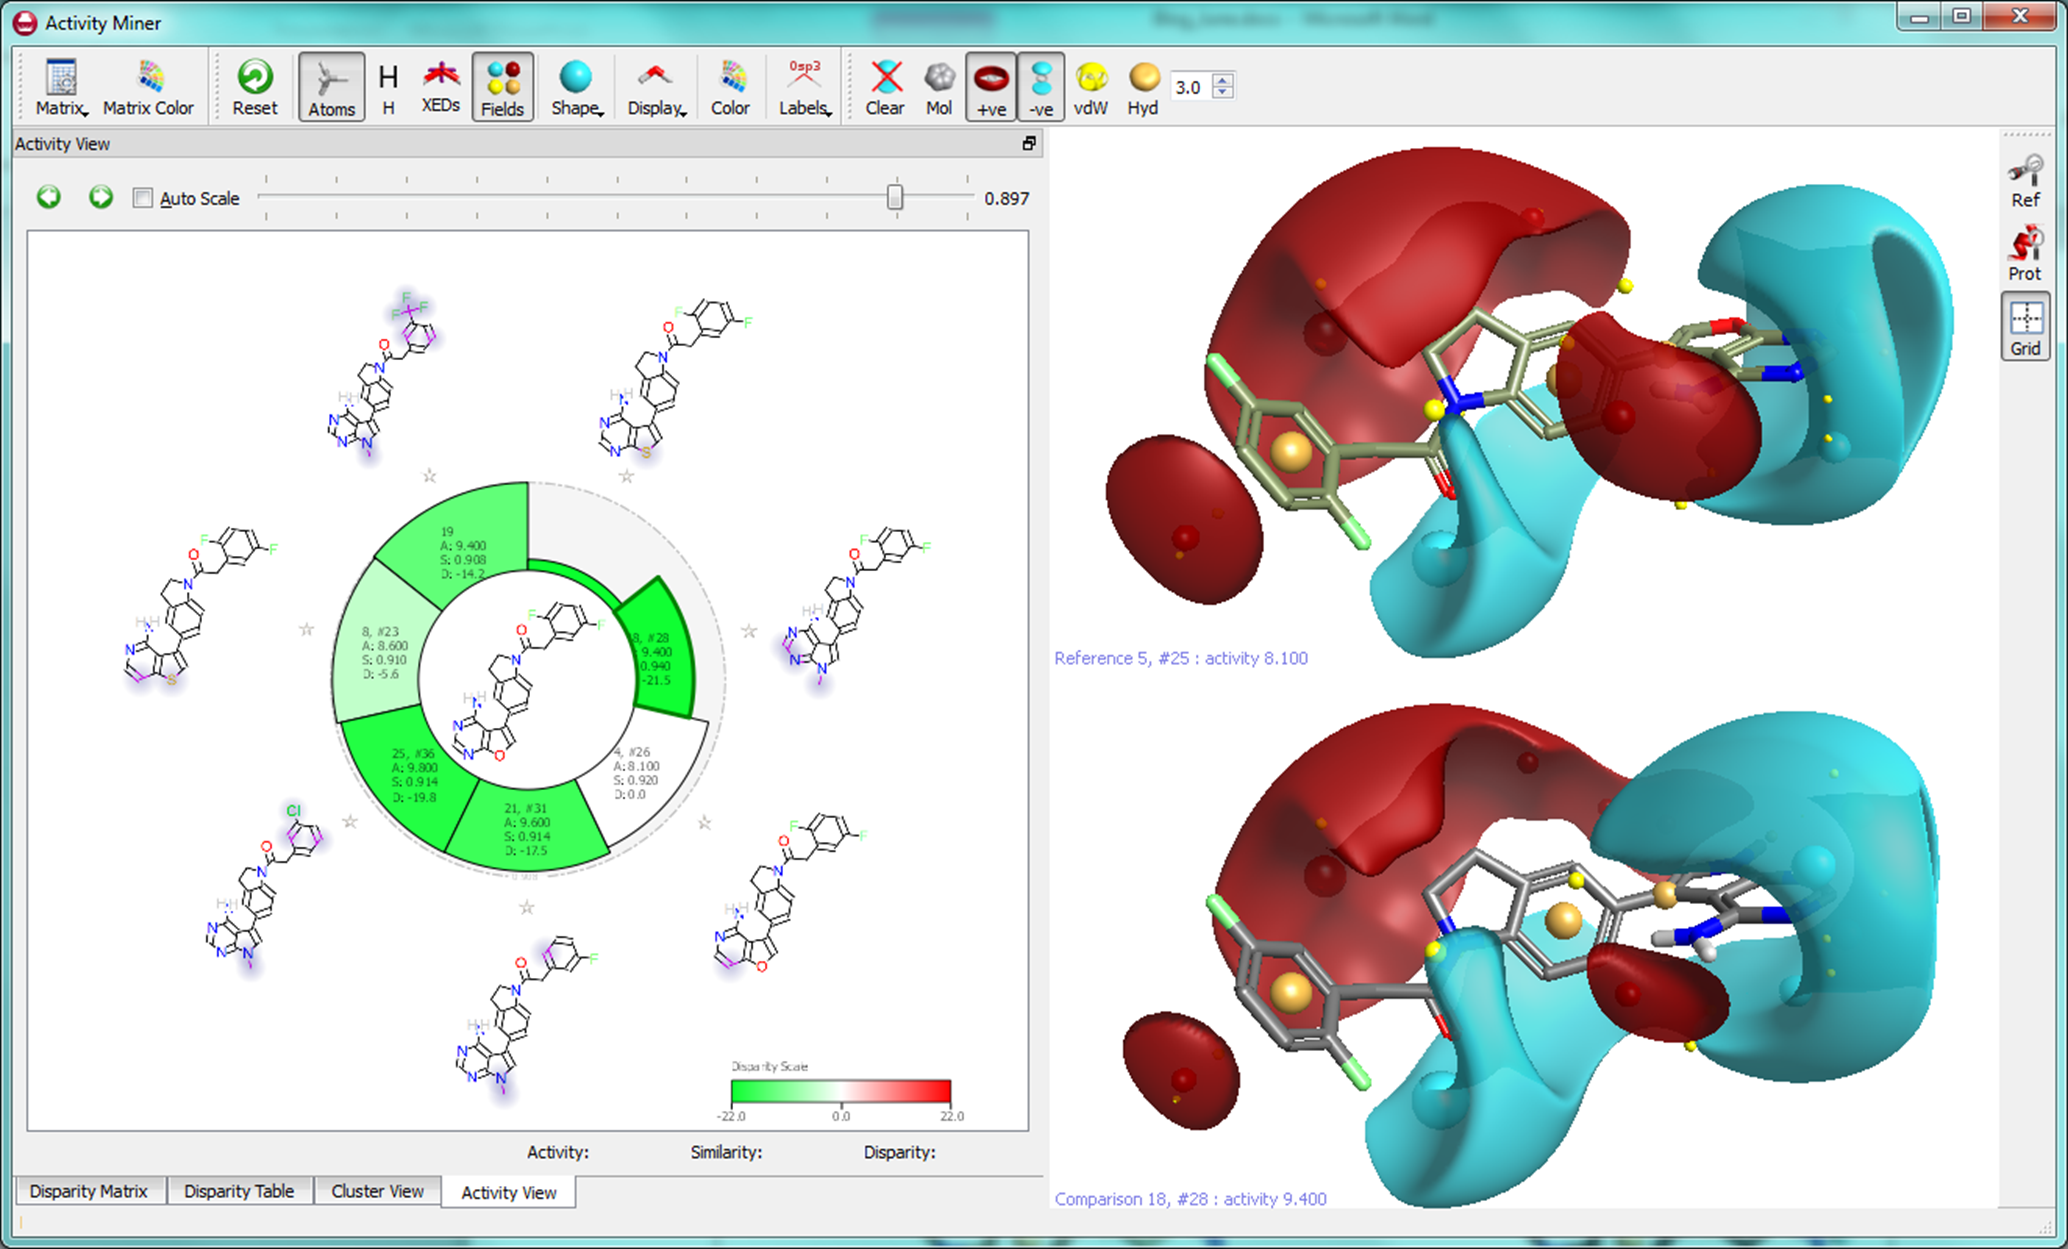
When using molecule “5, #25” as a focus, we find a number of other molecules with substitutions to the furanopyrimidine core leading to increased activity. The molecule with the highest disparity is ’18, #28′ where the furanopyrimidine is replaced by a N-methyl pyrrolopyrimidine giving more than a log unit of activity improvement.
Based on these and other internal validation experiments, we believe this enhancement to both Torch and Forge to be a powerful tool for guiding lead optimization and mining the SAR to rapidly generate new and more active structures for experimental evaluation.
The Activity Miner module is due for release with the next versions of Torch and Forge due in September 2013 but we are looking for active beta testers to try this new feature through the summer. If you would like to give this functionality a try and promise to provide feedback (good and/or bad) during your sneak preview, we definitely want to hear from you. Please contact us to request a trial.

Dr Tim Cheeseright, Director of Products

Dr Rae Lawrence Technical Sales North America