Improving PROTAC properties via single-point changes to linkers
We explore how computational methods can be applied to proteolysis targeting chimera (PROTAC) design, to effectively tackle some of the ...
News
Torch is designed to provide medicinal chemists with an application that enables the rapid 3D design of new molecules in an easy to use and easy to learn application. We understand that your molecules need more than activity and have always presented a range of physicochemical properties (TPSA, logP, MW etc.) for every molecule. The latest release of Torch includes many more features to help you understand the properties of new molecules. It expands the range of data analysis techniques that you can use to decipher SAR or choose the best new molecule to progress into synthesis.
In this blog post I explore some of the new additions and improvements to some old favorites. Almost all of these features are also present in TorchLite – the free version of Torch. You can download TorchLite for free.
The choice of which molecule(s) to progress into synthetic chemistry depends on a number of properties – potential for activity, logP, MW, flexibility etc.. The problem faced by most project teams is one of balance in that although there is usually an ideal range of values for each property, not every property is equally important. For example, the ideal may be to have MW<500 and logP<3 but there may be more tolerance for a high MW if logP is well within range.
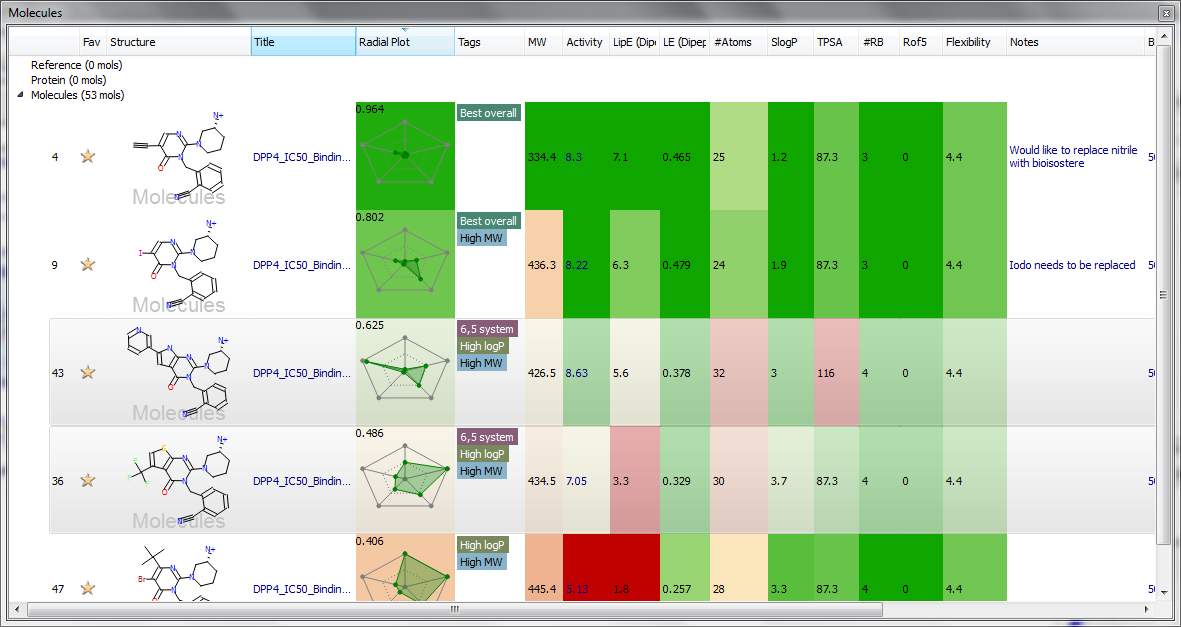
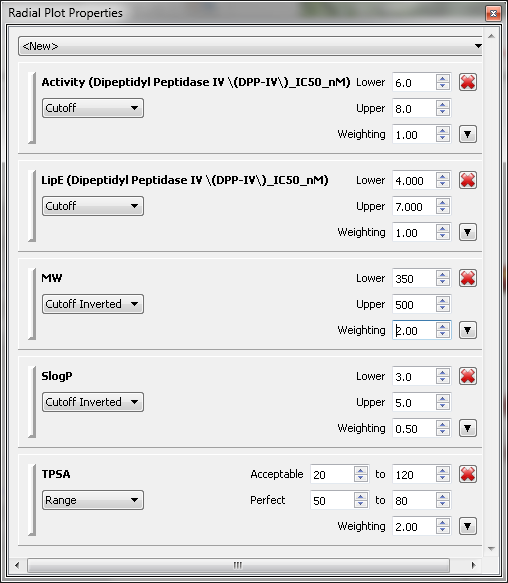
In the previous release of Torch radial plots were introduced as a simple way to display how multiple properties conform to a project profile. The new version of Torch has a modified radial plot properties window to enable a weight to be applied to each property independently. These weights are then used to combine the fit of each property to the overall project profile and provide a single score for how ‘good’ the molecule is. Additionally, we give the option to color the values in the results window by how well each property fits the profile that you have given. The result is a colorful and informative results table of many properties that can be sorted so that the ‘best’ molecules are placed together at the top.
 |
 |
| Torch 10.4 Molecules table with radial plot and coloring of cells based on fit to project profile. | Radial plot configuration includes weighting of properties. |
One of the most popular inclusions in Torch V10.4 is the ability to tag molecules with an arbitrary label. First introduced in Spark as a voting mechanism between colleagues (each tags their favorite molecules with their name), this feature has wide utility in Torch. It could be used as a way of labeling different series, marking sets of molecules as interesting or highlighting different substitution patterns as well as identifying the molecules to progress to synthesis. Filtering the dataset on the tags is a powerful method of visualizing, selecting and examining subsets of molecules.
Each molecule in Torch exists in a single ‘Role’. Previously there were only three Roles – ‘Reference molecules’, ‘Protein molecules’, and ‘Molecules’. In V10.4 you have the option to create additional Roles to store your molecules. Unlike tags, a molecule can have only one Role and hence it is a higher level division of your dataset. There is no limit to the number of Roles or how you use them, so you can divide your molecules in a way that works for you. For example, we often use Roles to keep track of different series, or for separating designed molecules from those that have been sent for synthesis and those that have been biologically tested! Once created, molecules can be dragged and dropped into a new Role or all the molecules in a single Role can be selected with a single click. This will further the improve the analysis of larger numbers of compounds and help you focus your attention on those that matter to you today.
Alongside the new ways to organize your molecules come new ways to view your molecules.
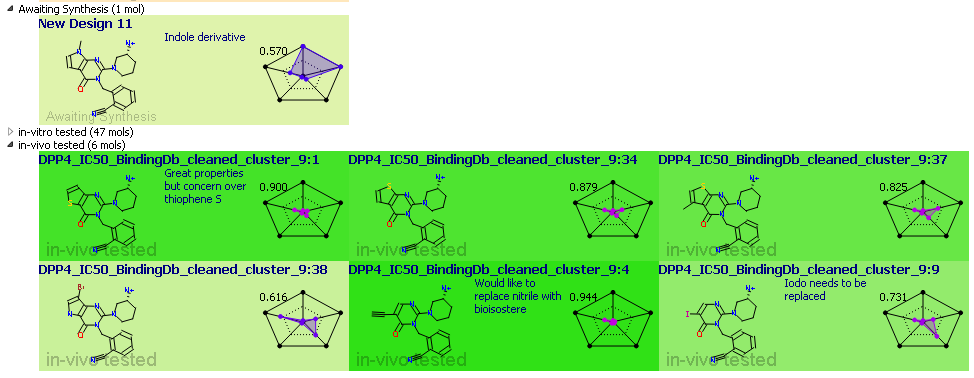
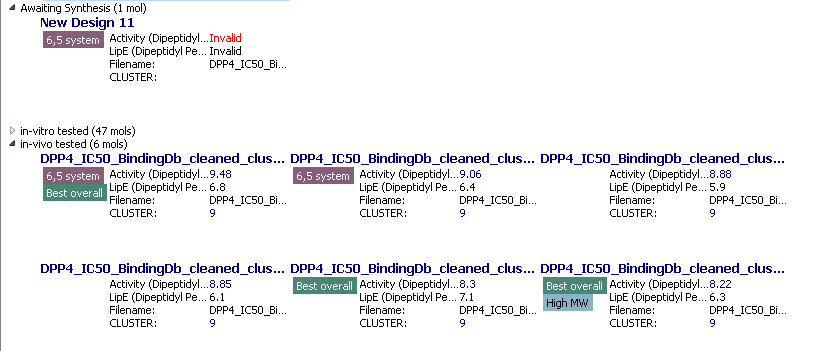
The new tiles view of molecules enables you to see more molecules at a time than can be presented in the spreadsheet approach of the ‘molecules table’. Each tile can be configured with exactly the data that you are interested in, be it the radial plot of physical properties, the molecule tags or the structure. Tiles are still organized into Roles, can be sorted by any of the numerical columns in the project and are colored to match the compound in the 3D window.
 |
 |
| Tiles configured to show structures, tags and radial plots and colored according to the radial plot score. | Uncolored tiles showing tags and selected data only. |
To aid analysis of data trends the graphing capabilities of Torch have been improved to include histograms, multiple series and some statistics. All graphs are interactive in that selection in one graph displays the compounds in the 3D window and selects the corresponding points in the other graphs. Using these simple tools greatly enhances your ability to interrogate your molecules to find the properties that matter to your project and then to use these in the design of new compounds.