Improving PROTAC properties via single-point changes to linkers
We explore how computational methods can be applied to proteolysis targeting chimera (PROTAC) design, to effectively tackle some of the ...
News
One of the things that distinguishes 3D virtual screening methods (such as Cresset’s Blaze) from 2D methods such as fingerprints is that you have to start worrying about conformations. A molecule only has one ECFP4 fingerprint, but if it is flexible then it has lots of shapes and pharmacophores. How to deal with this is one of the fundamental questions in ligand-based virtual screening (LBVS).
A few methods such as some docking tools explicitly search the conformation space as part of the scoring algorithm, but most ligand-based methods rely on pre-enumeration of a set of conformations of the molecules to search. A few notionally 3D methods avoid this by using only a single conformation of each compound, usually that chosen by some 3D coordinate generation program such as Corina. I would argue that these methods are actually 2D methods in disguise, as the ‘3D’ properties they calculate are determined by the combination of the topology and the rules in the Corina database.
Assuming that we are properly considering conformations, the big question that required answering is: how many? The naïve answer is ‘all of them’, but that turns out not to be that useful for three reasons. Firstly, if you define ‘conformer space’ as the set of structures sitting in potential energy local minima, then the space depends quite strongly on the force field and solvation model. Secondly, although this definition works for small and simple molecules, once you move to large and more flexible molecules it becomes less useful: rotating a central bond in the molecule by a few degrees may have virtually no impact on the conformational energy but may move the ends by enough to give a significantly different pharmacophore. The conformation space you need to consider thus has to be wider than just the potential energy minima. Thirdly, there are just too many: the number of conformations goes up exponentially with the number of rotatable bonds.
As a result, most LBVS systems perform a limited sampling of conformation space, generally by capping the number of conformations that are considered for a molecule. As the computational cost increases with the cap, we now need to decide what that should be. A recent Schrödinger paper by Cappel et al. found that this limit is actually very low: although a full exploration of conformation space is necessary to get good results in 3D-QSAR, you only need a fast and limited conformational search to get good LBVS performance.
In the past we have done several analyses of Blaze performance vs. the number of conformations, as a result of which we raised the recommended maximum number of conformations from 50 to 100 quite a few years back. The Schrödinger paper seems to contradict this recommendation, and so far we’ve never investigated Blaze performance with really small numbers of conformations, so it was time to have another look.
To do this, we grabbed a few of the DUD data sets that we examined in the original FieldScreen publication, and re-ran them with differing numbers of conformations for the actives and decoys: 5, 10, 20, 50, 100 and 200. The results are shown in Figure 1, firstly as the ROC AUC value, and then as the cluster-corrected ROC AUC value where the results are assed in terms of number of chemotypes retrieved rather than the number of actives.
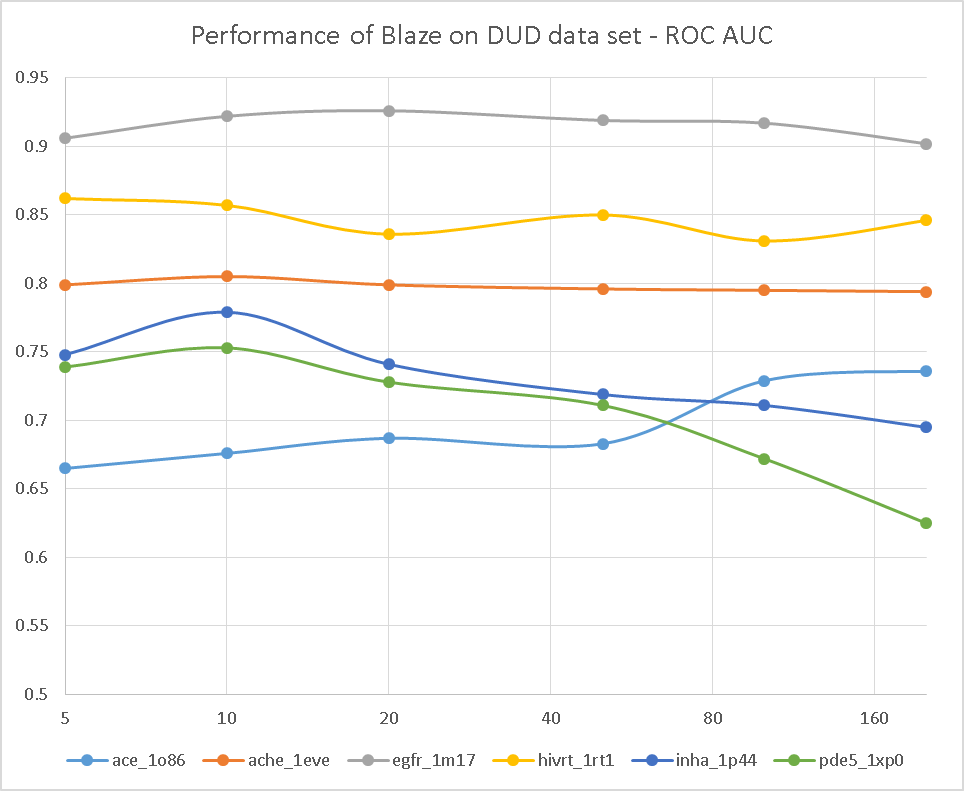
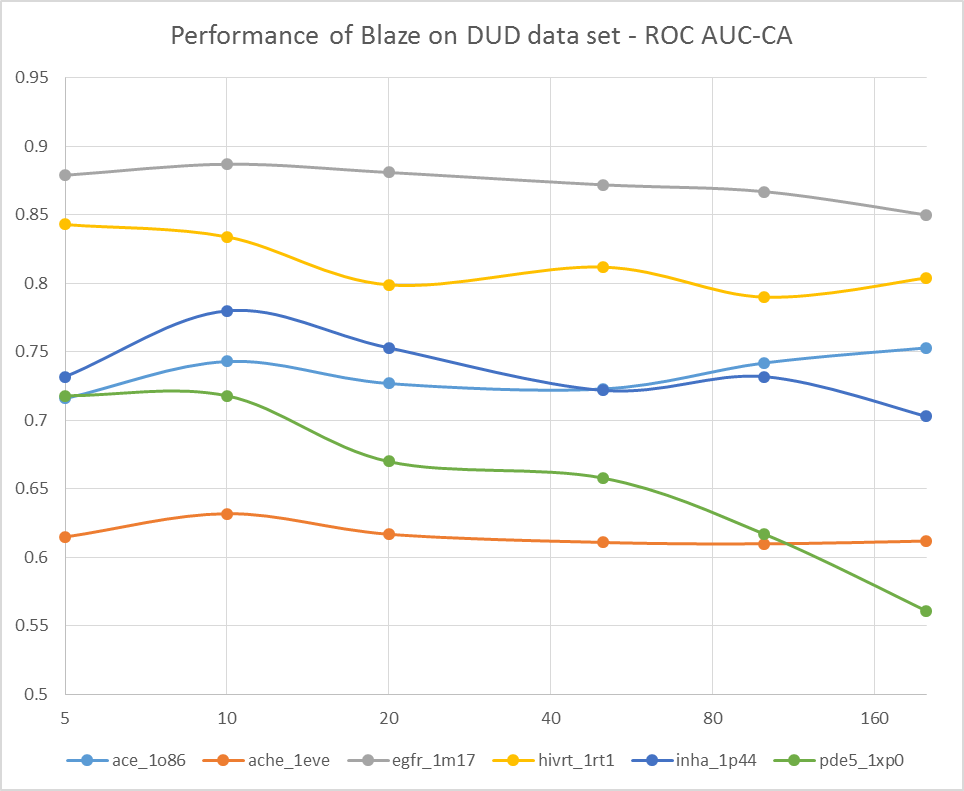
Well, this is pretty conclusive. The VS performance doesn’t show any consistent trends with numbers of conformations: a few searches get better, but a few get worse. Overall the average performance is much the same (or possibly slightly worse) with 200 confs as it is with 5 confs. Looks like Cappel et al. were right, after all.
Or were they? There are several big issues with using retrospective data sets such as DUD to do this sort of analysis. This first is that the actives and inactives come from different chemical spaces. The actives are chosen from J. Med. Chem. papers and tend to be highly-optimised compounds with a regrettable lack of structural diversity, and the inactives are chosen from some chemical space (ZINC, in the case of DUD) with some effort put in to match the properties of the inactives to the actives (number of heavy atoms, etc.). However, it is very difficult to ensure that the decoys actually match the actives (and harder still to define properly what ‘matching’ should actually mean).
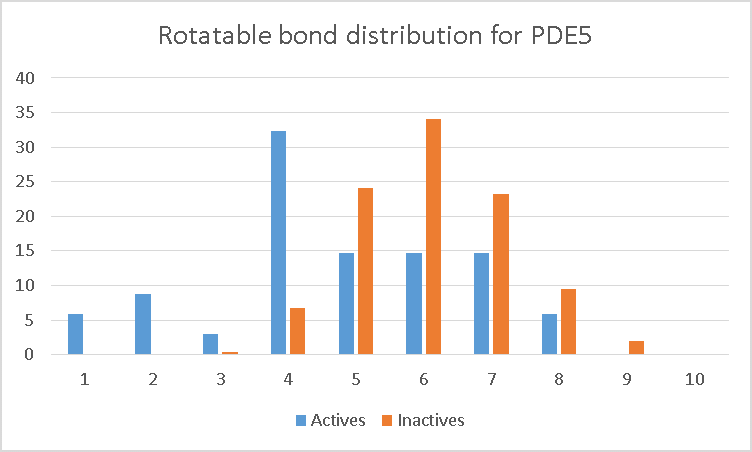
The PDE5 data set illustrates the problem. From the graphs, it can be seen that the ROC AUC declines markedly as we increase the number of conformations. The reason becomes apparent when we examine the distribution of rotatable bonds in the data set (Figure 2). The orange bars are the decoys, while the blue bars are the actives. As can be seen, the actives are significantly more rigid than the decoys. As a result, when you increase the number of conformations, the scores for the decoys are more likely to increase (as you find conformers that better match the query) than the scores for the more rigid actives.
The other data set with decreasing performance with increasing conformer count is HIV RT. Here the distribution of rotatable bonds is much more similar when comparing actives and decoys. However, let’s examine more closely the structures of the first 12 hits in the 5-conformation data set (Figure 3). The first hit is the query molecule itself, and 8 of the top 12 hits are very structurally similar to it. Although some of these have a high rotatable bond count (e.g. the third hit), matching just the core pyrimidinedione and the pendant benzyl is enough to give a high similarity score; the remaining flexible portions of the molecule are not very large and hence only have a modest contribution to the score. As a result, a high score is obtained for the third hit even though the flexible glycol chain is not in the optimal conformation.
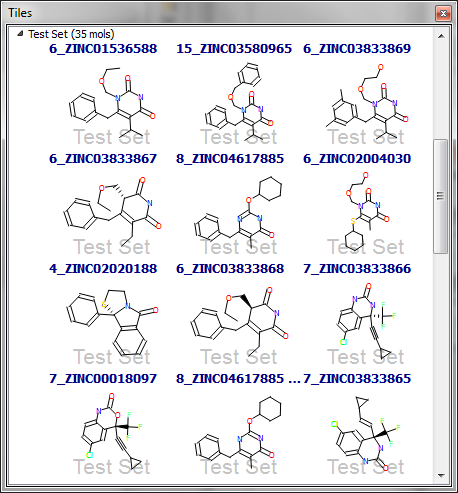
The remaining 4 of the top 12 hits all have very little flexibility (1-2 rotatable bonds), and hence are just as easy to find in the 5-conformer data set as the 200-conformer one. The apparent successful performance of the HIV RT search with only 5 conformations is thus misleading: we find the molecules from the same series as the query and the rigid actives earlier than we do in the 200-conformer data set, and these results mask the better performance for the more ‘interesting’ actives in the latter.
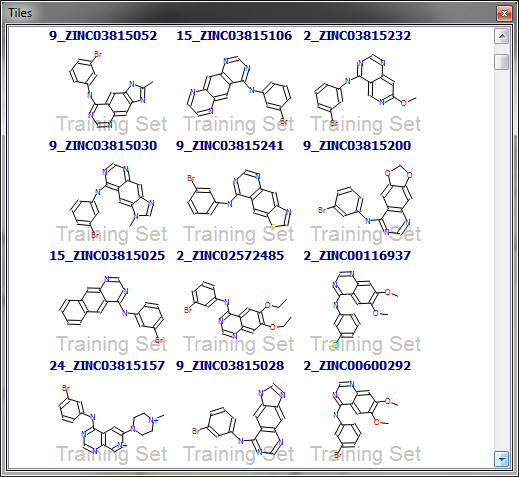
The other data sets all tell a similar story. For example, consider the EGFR data set, on which superb performance is obtained even with only 5 conformations. Looking at the actives, they all seem to consist of a phenylamino-substituted bi- or tricyclic heterocycle (Figure 4). In fact, of the 396 actives, 329 match the SMARTS pattern ‘c-[NH]-c’. Even a minimal conformational sampling is likely to produce a conformation where the two aromatic rings are in roughly the correct orientation, and as a result superb screening results can be obtained even with the 5-conf data set. However, this is really an artefact of the lack of chemotype diversity rather than a true reflection of the performance.
So, what does this experiment (and the analogous ones carried out by Cappel et al.) tell us? Unfortunately, they tell us more about how difficult it is to set up a retrospective virtual screening test set than anything about the optimal parameters to use. The lack of diversity in actives gleaned from the literature, together with the difficulty in property-matching decoys to the actives, mean that the results from this sort of analysis should be taken with a very large pinch of salt indeed. It should be pointed out that Cappel et al. used all 39 of the DUD data sets in their analysis: in our FieldScreen paper we showed that only 15 of these have enough chemotype diversity to be useful for testing LBVS systems, and as we have seen here even those 15 aren’t diverse enough to make robust conclusions.
In their paper Cappel et al. state that they obtained almost identical enrichment values whether they used the correct bioactive conformation or the lowest energy conformation of each query molecule (as determined by their force field) . If the enrichment performance does not depend on the query conformation, then by definition either your method isn’t a 3D method and is doing a 2D search in disguise, or the validation data you are using is biased. The low diversity of actives in the majority of the DUD data set argues for the latter.
I believe that the correct way to assess the relative and absolute performance of VS methods is to test them on actual screening data, not on artificial test sets. Big pharma companies have decades of HTS data waiting to be analysed: the hits are from the same collection as the decoys, they are weak binders rather than optimised compounds, and there are lots of them. Unfortunately, this data is not available to independent researchers. Researchers in big pharma, who do have access to this data, tend for some reason to publish VS performance analyses on literature data sets instead. If any big pharma researchers reading this post fancy working with us on examining the issue of conformation space sampling for virtual screening on their HTS data, then please do let us know.