Improving PROTAC properties via single-point changes to linkers
We explore how computational methods can be applied to proteolysis targeting chimera (PROTAC) design, to effectively tackle some of the ...
News
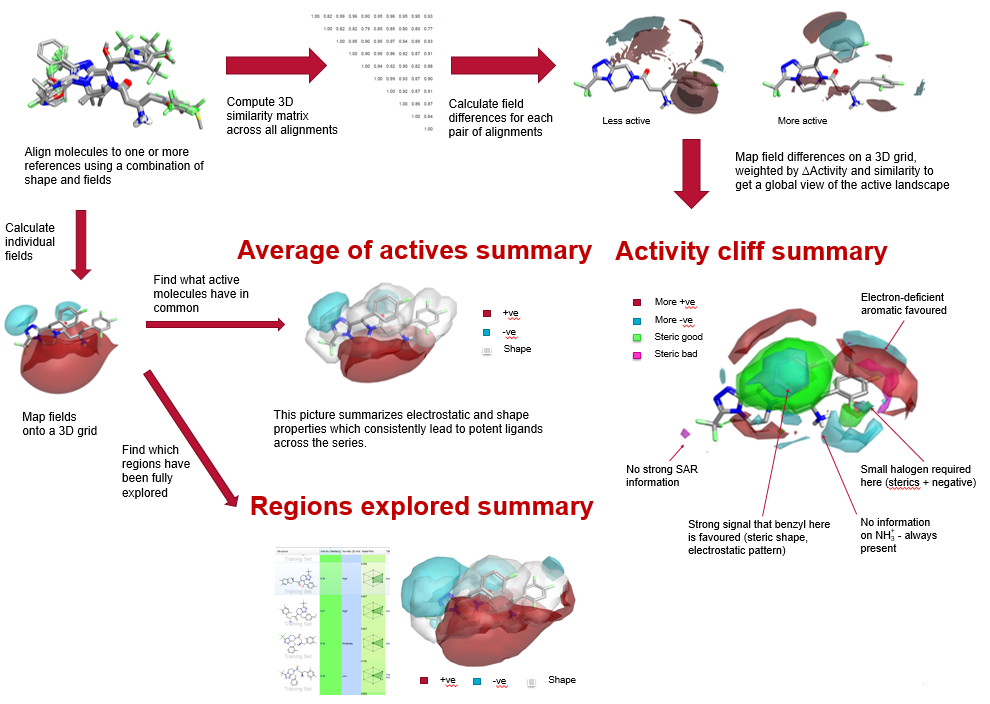
In drug discovery programs, summarizing and understanding the SAR for large sets of compounds can be both difficult and time-consuming. It is often the responsibility of the computational chemist supporting the project team to carry out this analysis, sharing the results with medicinal chemists in a clear and concise manner, to inform new molecule design and help them define the future directions of the project. With Activity Atlas complex SAR can be easily summarized into a visual 3D map, condensing a large table of data into a single picture. Activity Atlas is a probabilistic method of analyzing the SAR of a set of aligned compounds as a function of their electrostatic and shape properties. The method uses a Bayesian approach to take a global view of the data in a qualitative manner, taking into account the probability that a molecule is correctly aligned.
Despite utility in extracting useful SAR from sets of related compounds, 3D-QSAR techniques are known to perform poorly where there are activity cliffs. Equally, activity cliff analysis is a powerful technique for locating the most important changes that have been made within a series, but it looks at pairs of compounds in isolation rather than examining the entire data set.
Pairs of compounds with a high similarity and a large difference in activity carry important information relating
to the factors driving activity. This analysis has traditionally been done using 2D similarity metrics, but we have extended this to 3D similarity using computationally aligned molecules. We present a technique to analyse multiple pairs of molecules simultaneously to derive a global view of the activity cliff data, a method we call Activity Atlas. Activity Atlas generates three distinct visually striking maps of the electrostatic, shape and hydrophobic properties around molecules:
A Bayesian approach was taken where each pair of molecules provides evidence as to whether the difference in electrostatic and steric potentials within the pair in a particular region of space contributes to a change in activity. More than one alignment is considered for a molecule, and a weight is assigned to each alignment based on its score compared to the best-scoring alignment. This allows cases where a molecule has a flexible substituent which is not fully constrained by the initial alignment to be handled correctly.
Treating pairs of molecules rather than individuals allows the technique to be weighted towards describing the steep regions of the activity landscape correctly, where QSAR methods have generally struggled.
In contrast to matched molecular pair analysis, this analysis requires fewer molecules and extracts more information,
as it can handle pairs of molecules with multiple changes, and it also includes non-identical but correlated molecular transformations. For example, a Me->F and an Et->Cl transformation both provide information about the effectiveness of replacing a small hydrophobic group with a small electronegative group, but the correlation is missed in a standard MMP analysis.
Examination of the steric and electrostatic maps for the three subtypes clearly shows which regions should be targeted in order to enhance subtype selectivity.
In the example below, the right hand side of the molecules can be used to discriminate between A3 and the other two subtypes, while A1 and A2a can be separated by increasing steric bulk and positive charge around the top of the molecules.

A traditional 3D-QSAR model was built on the same data set (q 2 = 0.7). While 3D-QSAR seems better at extracting
information where SAR is continuous, Activity Atlas gives more definition in regions where SAR requirements are critical.
The Activity Atlas technique is a powerful way of summarizing SAR data in 3D. By combining information across multiple activity cliffs, it enables a global view of the critical points in the activity landscape.
The average of actives summary captures in one picture the 3D requirements for potency, while the Regions explored summary enables prioritizing compounds which add crucial SAR information over trivial analogues.
These visually appealing maps provide an insightful and highly intuitive way of conveying valuable SAR information from computational to medicinal chemistry groups.
J. Chem. Inf. Mod. 2006,46, 665-676
J. Chem. Inf. Model. 2011, 51, 258-266
J. Med. Chem. 2005, 48, 141-151
J. Med. Chem. 2008, 51, 589–602
Bioorg. Med. Chem. Lett. 17 (2007) 5934–5939
Bioorg. Med. Chem. Lett. 17 (2007) 3373–3377
Chemom. Intell. Lab. Syst. 2001, 58, 109-130
Chemom. Intell. Lab. Syst. 1993, 18, 251-263