Improving PROTAC properties via single-point changes to linkers
We explore how computational methods can be applied to proteolysis targeting chimera (PROTAC) design, to effectively tackle some of the ...
News
TorchLite is the powerful freeware 3D molecule viewer, editor and design tool from Cresset. However, there are situations in which modeling with TorchLite is simply not enough and you need to access the full power of Torch. This blog post highlights some of the features which make Torch a powerful molecular design tool for medicinal and synthetic chemists.
You can see several interesting applications of TorchLite in our case studies and web clips. With TorchLite, you can view the results of ligand-based or structure-based virtual screening, understand the shape and electrostatic character of active molecules and design new molecules to match their pattern. But what are the differences between TorchLite and its big brother Torch? When should you start using Torch?
In this blog, I highlight some of the additional features available in Torch, but not in TorchLite, with examples of their application.
The web clip Visualizing field changes to understand SAR shows how to quickly investigate the SAR of a small dataset of NaV1.7 inhibitors using TorchLite. Structures were manually sketched using the built-in 3D molecule editor, quickly minimized and saved in the Molecules table and NaV1.7 activity data manually entered. This works nicely for this small dataset, however, for larger compound sets manual editing and data entry is slow and open to human error. Also, manual editing and minimization in TorchLite cannot replace a full exploration of the conformational space of compounds, which ensures that diverse, low energy conformations are considered in the SAR analysis. Finally, while alignment is straightforward for the simple changes carried out in the web clip, a robust method for sensibly aligning the compounds is required when more complex structural changes are made.
This is the most important difference between the two packages: conformational exploration and alignment can be carried out in Torch (and Forge), but not in TorchLite.
In Torch, molecules are aligned to one or more reference molecules using fixed conformations, which can be imported into Torch or calculated on the fly by the application.
Suitable reference molecules are highly active molecules, preferably in their bioactive (protein bound) conformation. This is usually either experimentally observed (when crystallographic information is available), or derived from a docking experiment or pharmacophore modeling (these methods are also available in Lead Finder and Field Templater, respectively).
Using a ‘Normal’ alignment, the conformation ensemble for each molecule in the data set is aligned to the reference molecule in two stages. In the first stage the field points around a molecule are used to generate an initial alignment. In the second stage the initial alignment is optimized to get the best possible similarity score. In this stage, it is possible for Torch to use an excluded volume, typically derived from the protein crystal structure, that defines a region of space around the reference molecule that acts as a constraint on the alignments.
Torch offers an additional method for automated molecular alignment. Using the Maximum Common Substructure (MCS) approach each ligand is initially fitted to the reference molecule using a common-substructure algorithm and then additional groups are the fitted using the best match of field points and shape. This substructure alignment can be regarded as a ligand-centric view of the match to the reference where the use of the field points alone is akin to a protein-centric view of the alignment.
Each method has their advantages:
In the case study Activity Atlas analysis of sodium channel antagonists. Part I: SAR of the right-hand side phenyl ring a dataset of 62 pyrrolopyrimidine NaV1.7 antagonists was downloaded from CheMBL, conformationally explored in Forge and aligned by MCS to the chosen reference compound.
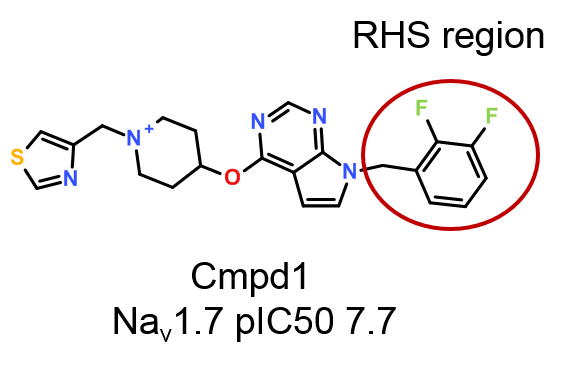
A more simple workflow can be implemented in Torch to quickly and effectively explore the SAR on the right-hand side phenyl ring (Figure 1) using Activity Miner, an optional module of Torch (included in Forge).
The ‘Substructure’ filter in Torch was used to select a subset of 17 compounds from the original data set which have the same scaffold and left-hand side substituent as Cmpd 1, but vary on the right-hand side phenyl, following the workflow shown in Figure 2.
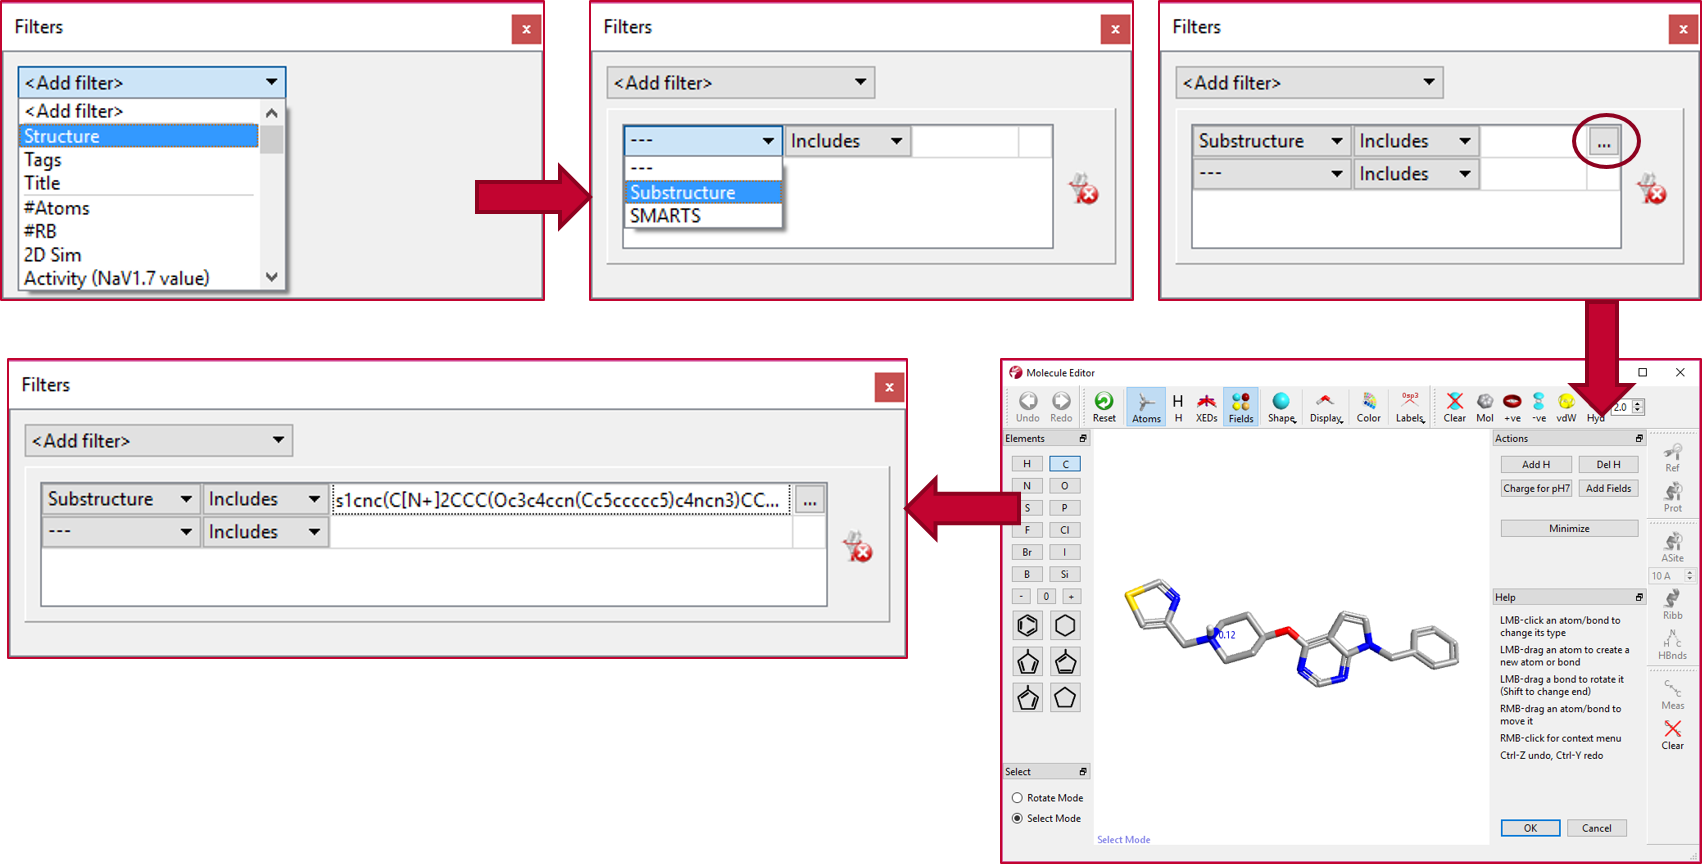
The SAR of the right-hand substituted compounds can then be explored using the activity view maps calculated and displayed by Activity Miner.
The activity view shows a focus compound surrounded by its nearest neighbors according to the chosen similarity metric (Figure 3). In this view the height of each wedge corresponds to the ‘distance’ between the pair: a smaller wedge reflects very similar compounds.
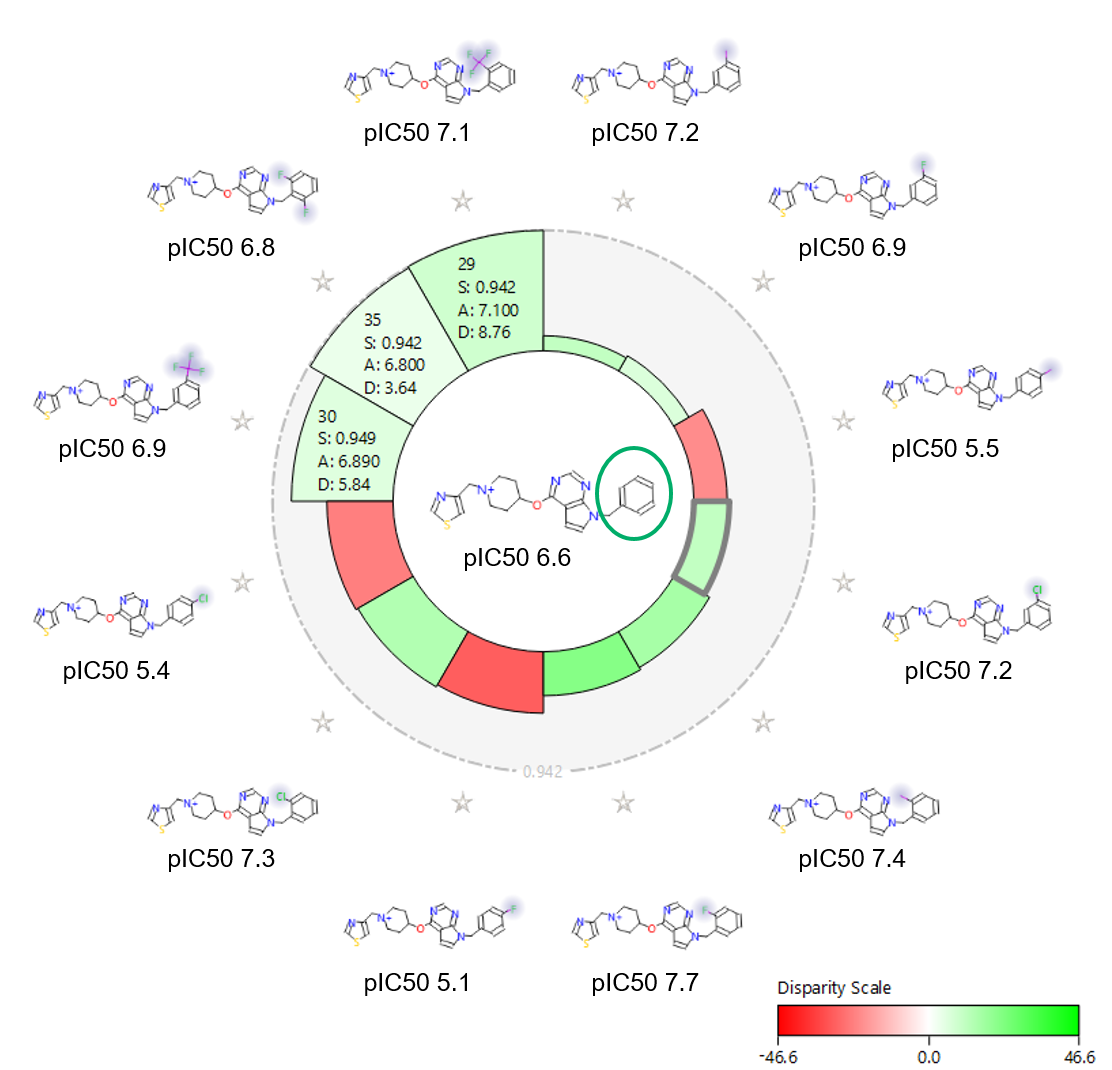
The shading echoes the disparity, which relates to how steep the activity cliff is. The result is a focused view of the SAR around a chosen compound.
Figure 3 also shows the activity view around the unsubstituted phenyl (pIC50 6.6). This view clearly shows that para substitution is always detrimental for NaV1.7 activity: ortho substitution is beneficial, especially with a small halogen like Fluorine; and meta substitution is also in general beneficial. Ortho, ortho substitution, instead, is less tolerated.
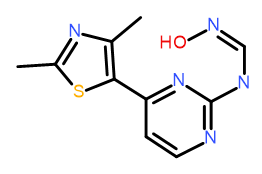
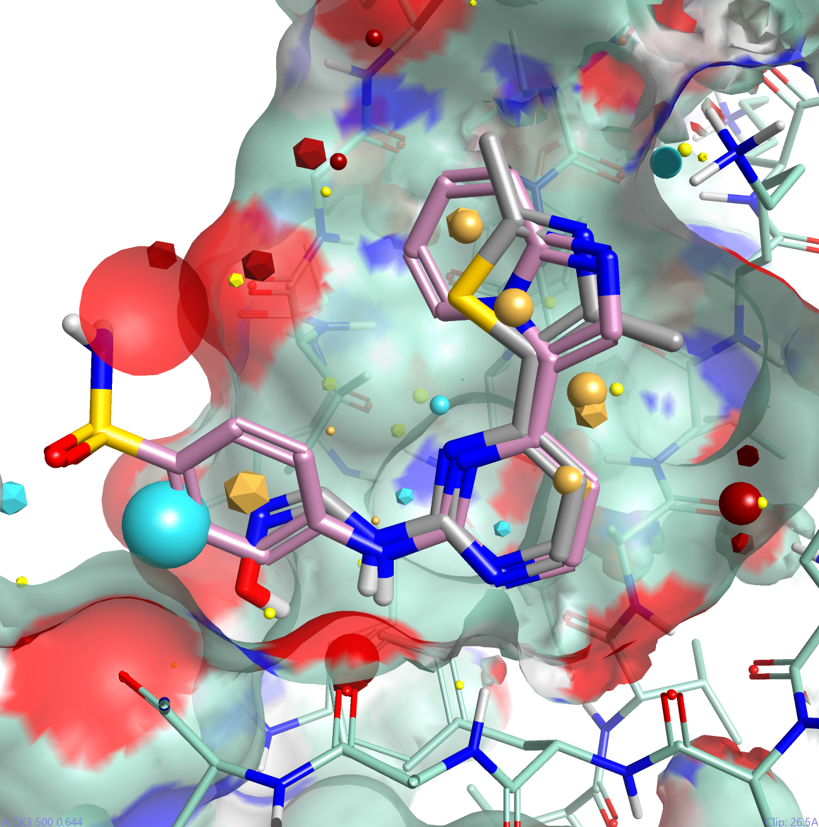
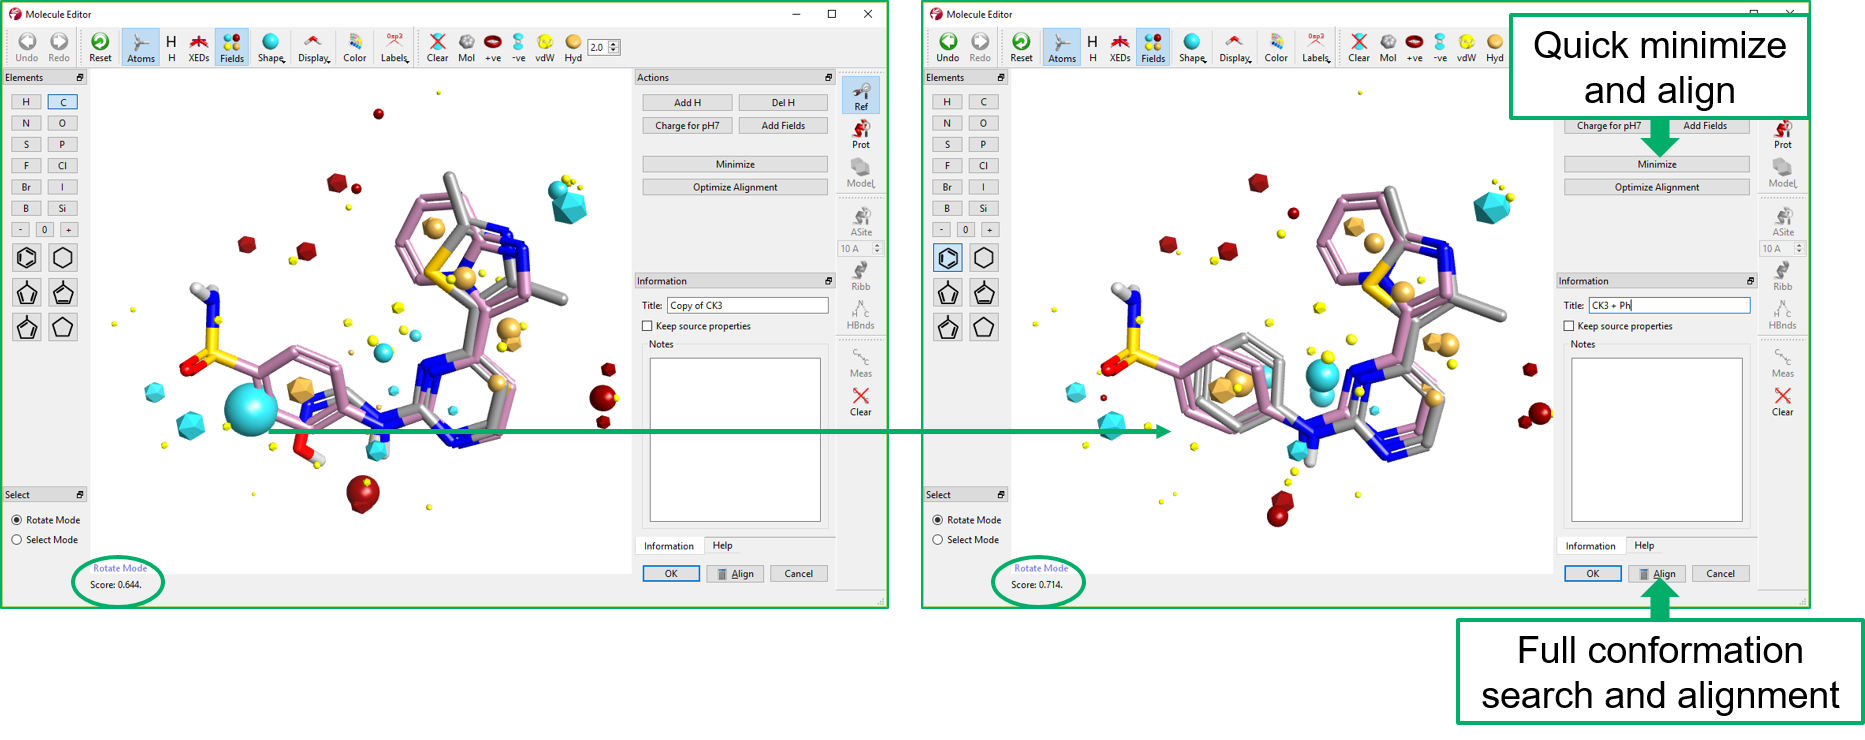
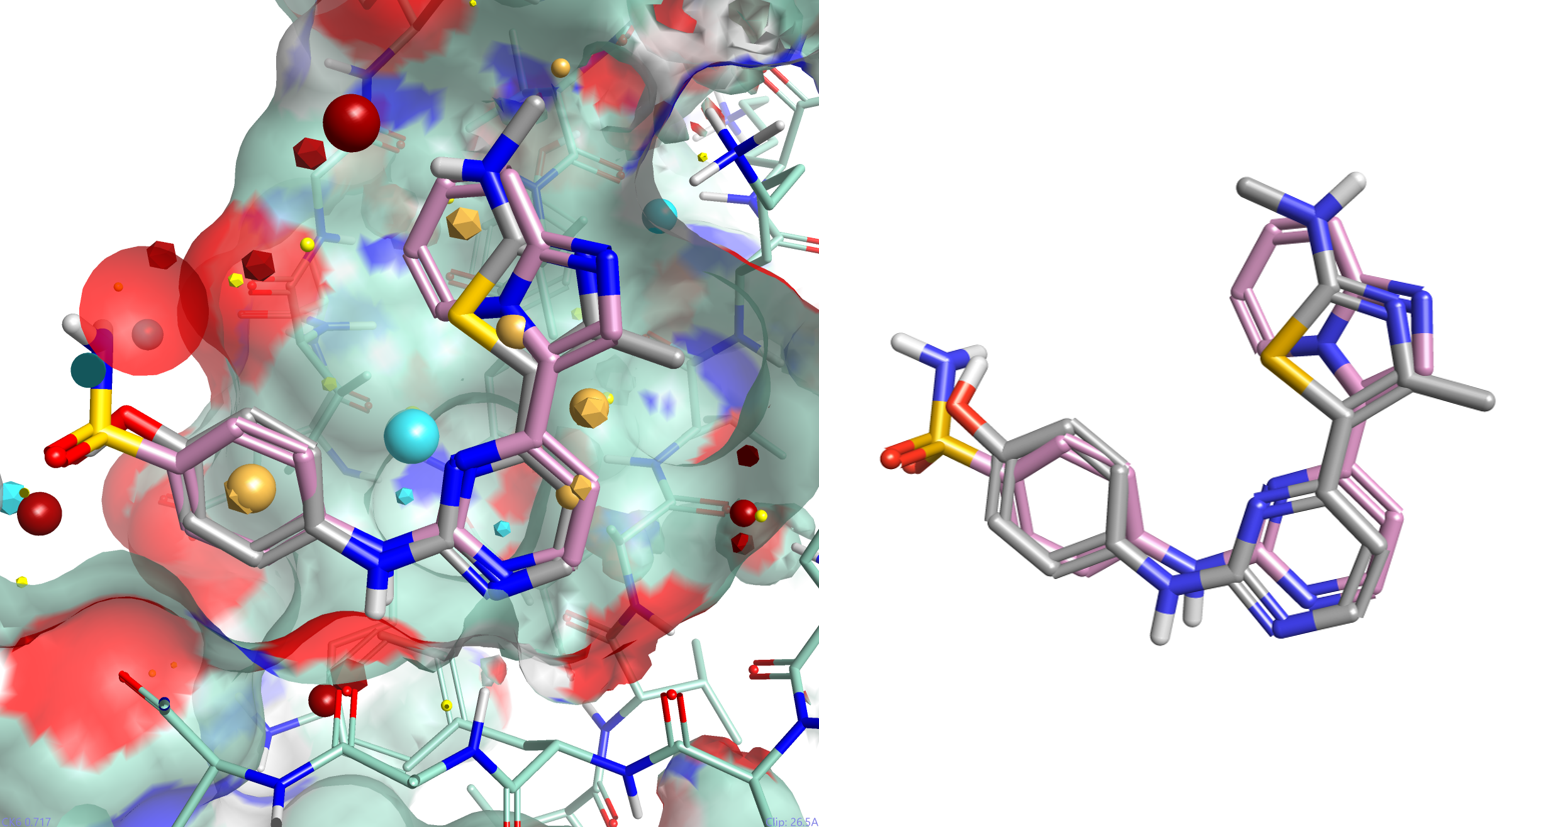
One of the major advantages of field based alignment is that it is agnostic to the chemical series that is being aligned. This can be used to aid in the design of new compounds in Torch by aligning diverse actives to a common reference and then transferring key functional groups across series. In this example, I use the crystal structure of HDT, a potent Cyclin-Dependent Kinase inhibitor, bound to CDK2 (PDB code 1OIT) to modify the design of an oxime based inhibitor.
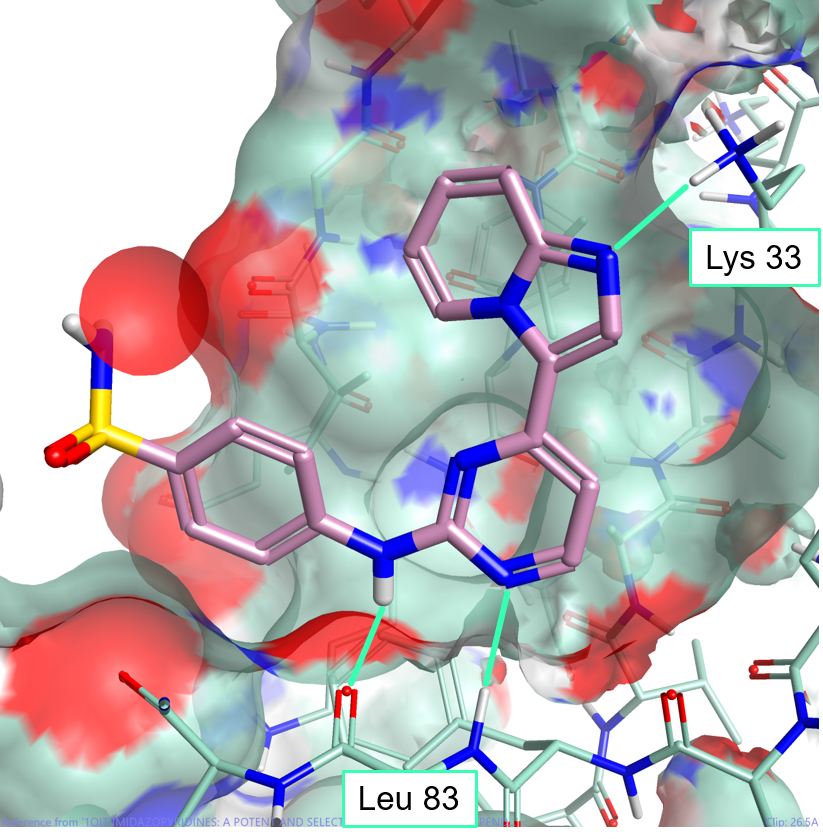
As can be seen in Figure 4, HDT interacts with the hinge region of the active site of CDK2 by making two H-bond interactions with the backbone carbonyl and NH of Leu 83, and a H-bond interaction with Lys 33. The sulphonamide group also makes H-bond interactions with Asp86 (not shown).
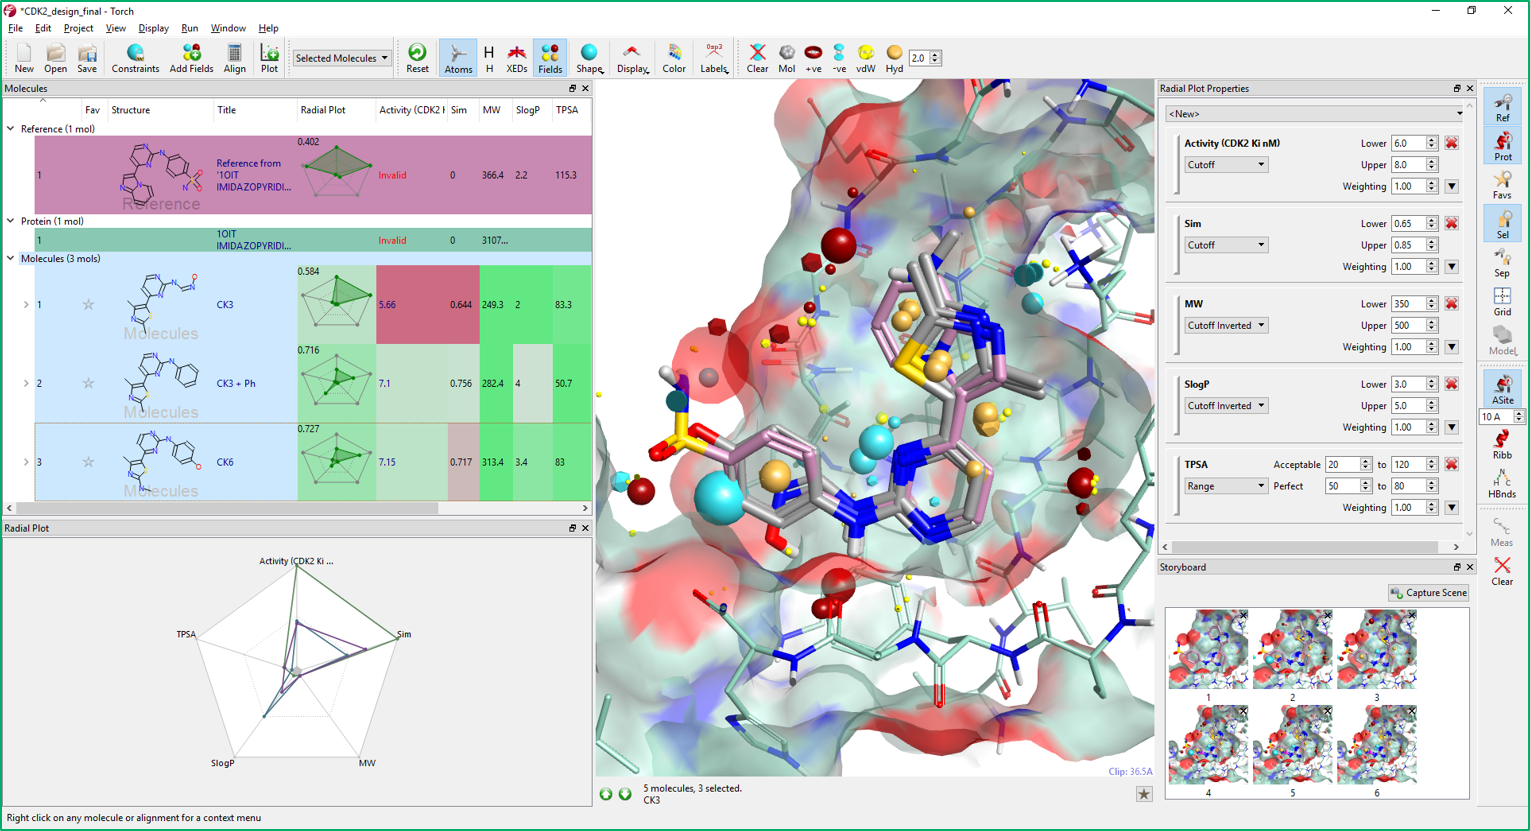
Multi-Parameter Scoring in Torch helps medicinal and synthetic chemists assess the overall physico-chemical profile of the compounds of interest using colors and radial plots. As can be seen in Figure 9, columns in Torch are colored according to a profile set up in the Torch preferences. Properties perfectly matching the desired profile are colored in green, those with an acceptable value in yellow, while those with an unacceptable value in red.
The profile can be tailored to the specific project needs in the Radial Plot Properties window. In this window, a weight can be also associated to each property based on its importance in the ideal project profile. The score and fit to the project profile for each molecule is then summarized in the radial plot.
The radial plot is based on the idea that molecule properties that are ‘perfect’ should be displayed at the center of the radial plot. Thus, a molecule with perfect or near perfect properties should have a radial plot with a small encapsulated area (shown in green). Conversely, poor properties would be plotted at the edge of the radial plot such that a molecule with sub-ideal properties would have a radial plot with a large enclosed area (this can be reversed using the Radial Plot Preferences).
In Figure 9, you can see the column coloring for the CDK2 project. Comparing the color coloring of CK3 and CK6, most properties have values matching the ideal property profile. CDK2 Ki has significantly improved from CK3 to CK6, while lipophilicity (SlogP) is less good in CK6. CK3+phenyl (Figure 9, Molecules table) is slightly less active than CK6 and its lipophilicity is high with respect to the other two compounds: another good reason for including a hydrophilic H-bond acceptor in the para position of the phenyl ring.
The radial plot properties are combined into a single score that represents the overall fit of molecule to the ideal project profile. Radial plots can be sorted and filtered based on this score, making it easier to select the best candidates for your projects.
This blog highlights some of the additional features in Torch, the powerful molecular design tool for medicinal and synthetic chemists.
Additional functionality available in Torch includes the capability to:
Contact us to benefit from this functionality and try the full power of Torch.