Improving PROTAC properties via single-point changes to linkers
We explore how computational methods can be applied to proteolysis targeting chimera (PROTAC) design, to effectively tackle some of the ...
News
Protein interaction potentials implemented in Flare,1 Cresset’s structure-based design software, were used to calculate a detailed map of the electrostatic character of the protein active site of Bruton’s tyrosine kinase2 (Btk). The interaction potential maps were compared to those of selected Btk ligands to get a detailed understanding of ligand binding and SAR. 3D-RISM analysis in Flare was applied to investigate the stability of the crystallographic water molecules populating the Btk active site.
Bruton’s tyrosine kinase is a member of the Tec family of non-receptor tyrosine kinases. Recent literature findings2 indicate that Btk inhibition could be an attractive approach for the treatment of autoimmune diseases such as rheumatoid arthritis, a progressive autoimmune disease characterized by swelling and erosion of the joints.
The published X-ray crystal structure PDB:4ZLZ shows that the 4RV ligand interacts with the active site of Btk (Figure 1 – left) by making H-bond interactions with Glu475 and Met477 in the hinge region. The pyridyl ring is involved in a cation-pi interaction with Lys430, with the pyridyl nitrogen making a water-mediated interaction to the P-loop residues Phe413 and Gly414. The replacement of 4-methylpyridin-3-yl with small bicyclic heterocycles like indazole in 4L6 (PDB:4Z3V, Figure 1 – right), displacing the water molecule and making direct H-bond interactions with the P-loop, led to the discovery of ligands with improved potency towards Btk such as compounds 4L6, 1 and 2 (see Table 1).3
In this case study, we used the protein interaction potentials and the 3D-RISM method available in Flare to investigate the electrostatics of the active site of Btk and the stability of the crystallographic water molecules. This information was then used to understand the SAR of the molecules in Table 1.
The 4ZLZ and 4Z3V ligand-protein complexes were downloaded from the Protein Data Bank into Flare, and carefully prepared using the Build Model4 tool from BioMolTech,5 to add hydrogen atoms, optimize hydrogen bonds, remove atomic clashes and assign optimal protonation states to the protein structures. Any truncated protein chains were capped as part of protein preparation.
The protein sequences were aligned in Flare using the COBALT6 multiple alignment tool and subsequently superimposed by means of a least squares fit of equivalent C.alpha carbon atoms.
The active site of the prepared 4ZLZ and 4Z3V ligand-protein complexes was minimized in Flare using the XED force field7 and Normal conditions (gradient cutoff: 0.200 kcal/mol/Å, 2,000 maximum iterations). The ligand structures were included in the minimization of the active site.
The Reference Interaction Site Model (RISM) is a modern approach to solvation based on the Molecular Ornstein-Zernike equation.8 3D-RISM has seen increasing use as a method to investigate the location and stability of water molecules in a protein.
Conceptually, 3D-RISM is equivalent to running an infinite-time molecular dynamics simulation on the solvent (keeping the solute fixed), and then extracting the density of solvent particles. The output of a 3D-RISM calculation consists in a grid containing particle densities, one for oxygen and one for hydrogen atoms. A thermodynamic analysis then assigns a ΔG value to each position on the grid, representing the ‘happiness’ of a putative water molecule at that position of the grid relative to bulk water.
3D-RISM calculations in Flare use Cresset’s XED force field, which offers the advantage of incorporating both electronic anisotropy and a certain degree of polarizability, and accordingly improves the effectiveness of the method.
A 3D-RISM analysis was carried out on 4ZLZ and 4Z3V to investigate the stability of crystallographic water molecules surrounding the 4RV and 4L6 ligands bound to the active site of Btk.
The following conditions were used:
Protein interaction potentials are an extension of Cresset molecular interaction potentials to proteins. Both are calculated using the XED force field. The approach is similar in principle to the calculation of ligand fields: the protein’s active site is flooded with probe atoms, and interaction potentials are calculated at each point. This method makes use of a distance-dependent dielectric function based on the work of Mehler,9 to better cope with the large number of charged groups in protein structures.
All the ligands in Table 1 belong to the same series as 4L6, so for this case study protein interaction potentials were only calculated and displayed for the active site of 4Z3V.
To obtain a sensible pose for the ligands in Table 1, the corresponding 2D structures were docked into the ‘dry’ (i.e., not including crystallographic water molecules) active site of 4Z3V using the Lead Finder10 method implemented in Flare.
Cresset’s ligand fields were then calculated and compared to the 4Z3V protein interaction potentials, to investigate the SAR for the ligand series.
At the end of a 3D-RISM run, a 3D-RISM water molecule chain is added to the protein structure. The water molecules in this chain occupy regions of high water density as predicted by 3D-RISM, and are colored according to the calculated ΔG for the whole water molecule, averaged over all orientations.
‘Happy’ water molecules (associated with a calculated negative ΔG) are colored in shades of green: these are water molecules which 3D-RISM predicts to be more stable in the protein than in bulk water, and hence more difficult to displace with a ligand.
‘Unhappy’ water molecules (associated with a calculated positive ΔG) are colored in shades of red: these are waters that are less stable relative to bulk water and hence more easily displaced by a ligand.
Figure 2 shows the results of the 3D-RISM calculation on 4ZLZ. The oxygen density surface (Figure 2 – left) clearly shows a region of localized water near the nitrogen of the pyridine, and the 3D-RISM localization algorithm (Figure 2 – right) suggests that a water molecule should exist in exactly the spot where it is seen in the crystal structure. The thermodynamic analysis indicates that this water molecule is neither particularly ‘happy’ nor particularly ‘unhappy’. This is consistent with the fact that this water molecule is displaceable (as proven by 4L6 and the other compounds in Table 1), but also indicates that the displacing group needs to have the correct electrostatics and shape to avoid losing affinity.
The oxygen density surface for 4Z3V is shown in Figure 3 – left. The 3D-RISM localization algorithm correctly identifies the position of the majority of crystallographic water molecules surrounding the 4L6 ligand bound to the Btk active site: many of these water molecules are predicted to be ‘happy’. Accordingly, a selected subset of the stable water molecules was included in the calculation of protein interaction potentials for 4Z3V, as they were considered to be an integral part of the protein active site with respect to ligand binding.
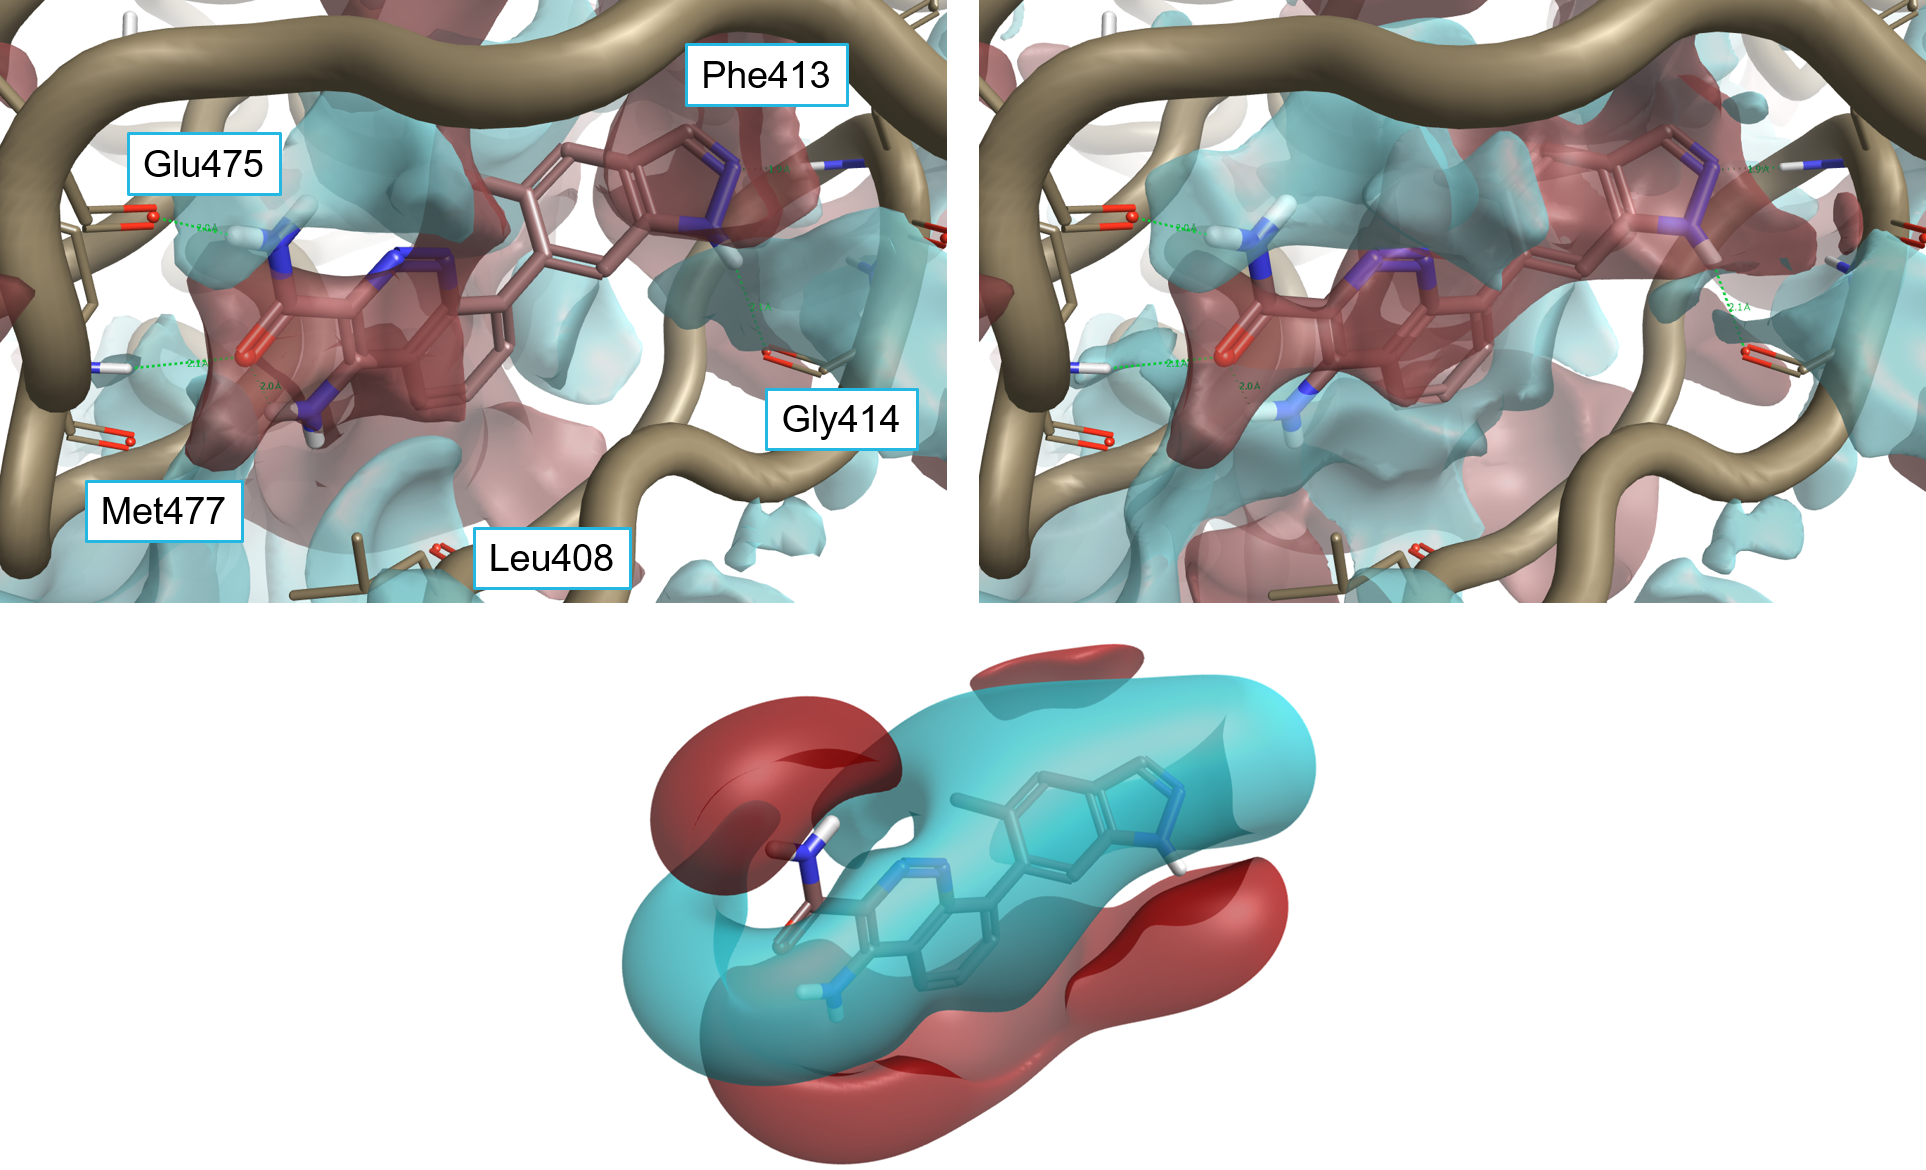
As shown in Figure 4, the protein interaction potentials of both the ‘dry’ (not including crystallographic water molecules) and ‘wet’ (including stable crystallographic water molecules lining the active site) active site of 4Z3V match the 4L6 ligand fields in a satisfactory manner.
In particular:
The inclusion of stable water molecules in the calculation of protein interaction potentials confirms this scenario. In this case though, the region of positive protein interaction potential in the middle of the 4Z3V active site is much larger and embraces most of the cinnoline-indazole ring system. This is indeed fully consistent with the negative ligand field surrounding the cinnoline-indazole ring system (Figure 4 – bottom).
Also, the 4-amino group on the cinnoline ring sits in an area of negative interaction potential which nicely matches the positive ligand field corresponding to this group.

A comparison of ligand fields with the protein interaction potentials for the active site of Btk provides some useful insight into the SAR of compounds in Table 1.
Compound 1 (pIC50 8.7) is one of the two most potent compounds in this data series,3 carrying a -OMe side chain on the indazole ring and a fluorine in position 5 of the cinnoline ring. The binding mode of 1 (Figure 5) is similar to that of 4L6. The compound makes H-bond interactions with Glu475 and Met477 in the hinge region, a cation-pi interaction with Lys430 (not shown), and H-bond interactions with the backbone of P-loop residues Phe413 and Gly414.
The fluorine group sits in a relatively large pocket close to a water molecule which it possibly displaces. The CH3 of the OMe group sits in an area of negative interaction potential.
Compound 2 is also one of the most active compounds in the data series3. Quite interestingly though, the NH on the indazole does not make an H-bond with Gly414, as it is turned on the other side, possibly making an
H-bond interaction with a nearby water molecule.
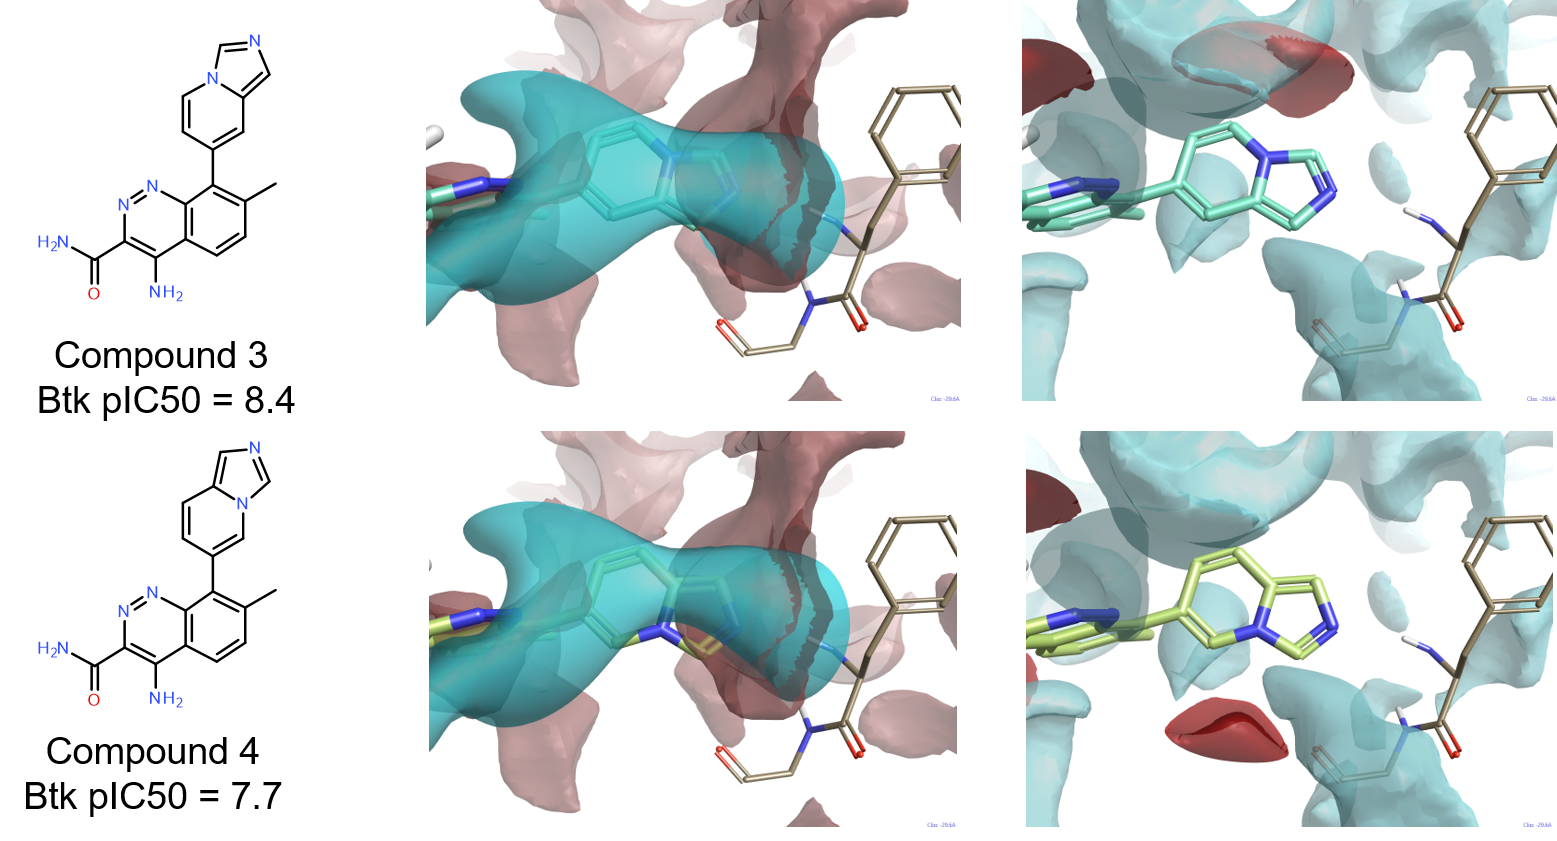
The good activity (pIC50=8.4) of compound 3 confirms that an H-bond donor on the bicyclic system is not an essential feature for a Btk ligand to reach good levels of activity. Quite interestingly, compound 4 (pIC50=7.7) is structurally very similar to 3, but significantly less active. The comparison of the ligand fields for these two compounds with the protein interaction potentials of the active site of 4Z3V provides a possible explanation, as shown in Figure 7. While for both compounds (Figure 7 – middle column) the negative ligand field shows a good complementarity with the positive interaction potential of the backbone NH of Phe413, the positive ligand field of 4 (Figure 7 – right column) does not match the negative interaction potential generated by the backbone carbonyl of Gly414.
For both compounds, the methyl group in position 7 of the cinnoline ring plays the same role of the methyl on the indazole ring of 4L6 in ensuring that the ligands achieve the correct conformation in the active site.

Protein interaction potentials and ligand fields, as implemented in Flare, are a powerful way of understanding the electrostatics of ligand-protein interactions. The inclusion of stable water molecules following a 3D-RISM analysis dramatically improves the precision of the method for the characterization of protein active sites. The information gained from protein interaction potentials can be used to inform ligand design, compare related proteins to identify selectivity opportunities, and understand SAR trends and ligand binding from the protein’s perspective.
1. http://www.cresset-group.com/products/flare/
2. C.R. Smith et al., J. Med. Chem. 2015, 58, 5437−5444
3. US patent 2015/0038510
4. V. Stroganov et al., Proteins 2011, 79(9), 2693-2710
5. https://www.biomoltech.com/
6. https://www.ncbi.nlm.nih.gov/tools/cobalt/re_cobalt.cgi
7. J.G. Vinter, J. Comput.-Aided Mol. Des. 1994, 8, 653-668
8. R. Skyner et. al., Phys. Chem. Chem. Phys. 2015, 17(9), 6174
9. E. L. Mehler, The Lorentz-Debye-Sack theory and dielectric screening of electrostatic effects in proteins and nucleic acids, in Molecular Electrostatic Potentials: Concepts and Applications, Theoretical and Computational Chemistry Vol. 3, 1996
10. O. V. Stroganov et al., J. Chem. Inf. Model. 2008, 48(12), 2371-2385