Improving PROTAC properties via single-point changes to linkers
We explore how computational methods can be applied to proteolysis targeting chimera (PROTAC) design, to effectively tackle some of the ...
News
Version 2 of Flare™, our application for fresh insights into structure-based design, is now available. I will briefly introduce the new science and functionality included in this version, which will be presented in full at the Cresset User Group Meeting on June 21-22.
Since the initial release of Flare, you repeatedly asked us to develop a smart way of quantifying the complementarity of ligand vs. protein electrostatics and suggested that this would be a rapid method for prioritizing new molecule designs.
Your requests have led to the introduction of Electrostatic Complementarity (EC) scores and maps in Flare V2, based on Cresset’s polarizable XED force field. These provide rapid activity prediction with visual feedback on new molecule designs, and prove invaluable for understanding ligand binding, structure-activity relationships and the ranking new molecule designs.
Electrostatic Complementarity scores quantify the ligand-protein electrostatic complementarity with three different metrics suitable for diverse protein-ligand scenarios. The calculation is fast and predictive: scoring a hundred ligands normally takes less than a couple of minutes on an average laptop and gives good correlation with activity in the majority of cases.
Electrostatic Complementarity maps are based on a calculation of electrostatic potentials for the ligand and the protein on the surface of the ligand. These potentials are then added together, normalized and scaled. Regions of the ligand surface where there is perfect electrostatic complementarity with the protein are colored green, while the regions where there is a perfect electrostatic clash are colored red.
Faster and improved surface generation code, and new protein surface coloring options to give you more insights into protein-ligand interactions and support molecule design, are also included in this release.
Coloring the protein surface according to the Wimley-White [1] residue hydrophobicity value is an excellent way of visualizing hydrophobic areas of the protein active site.
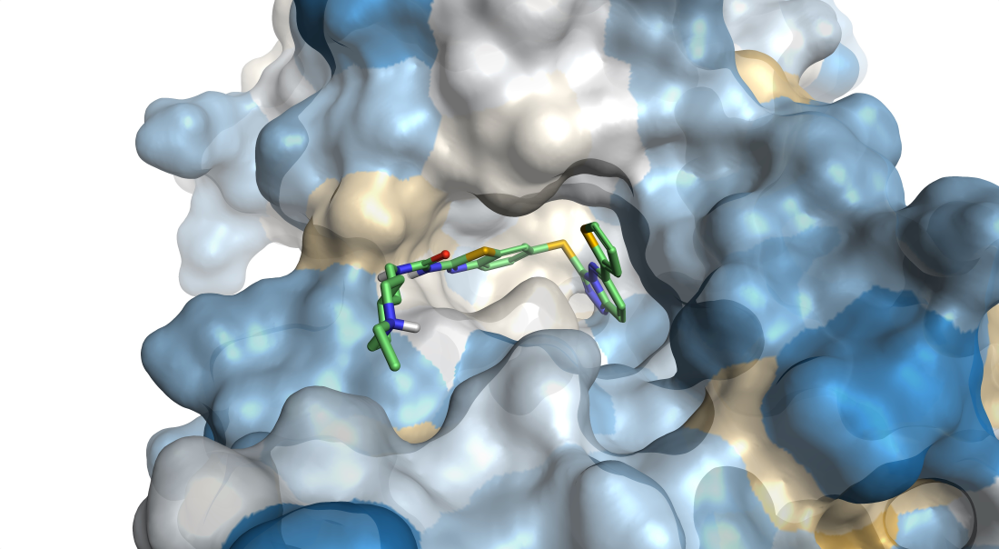
Figure 3. The surface of the binding side of PDB: 5HLW is colored by Wimley-White residue hydrophobicity from yellow (hydrophobic) to blue (hydrophilic).
Rapidly and easily dock your ligands in a single experiment to multiple protein conformations using ensemble docking. Results are saved as a list of docked poses for the ligands included in the study, each associated to a specific protein conformation.
Figure 4. Results of an ensemble docking experiment in Flare. Each pose is associated with a specific protein conformation, making browsing of results easy.
Significant improvements have been made to the ligand functionality in Flare V2.
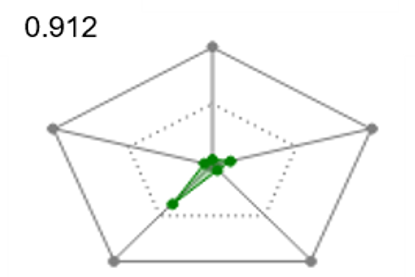
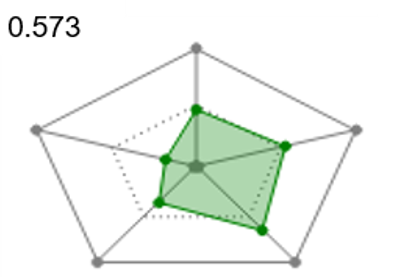
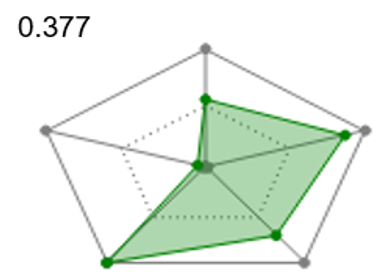
Radial plots are useful to gain immediate visual feedback about how each ligand matches the ideal physico-chemical profile for your project. To support Multi-Parameter Scoring, radial plot properties are weighted and combined into a single score that represents the fit of the ligand to the ideal physico-chemical profile. The radial plot score can then be used to filter or sort the ligands.
 |
 |
 |
| Good | Middling | Poor |
| Figure 5. Radial plots and radial plot scores for ligand showing a match to the ideal physical-chemical profile ranging from good (left) to poor (right). | ||
Flare V2 enables the definitions of filters (Figure 6) to show only the ligands that conform to a desired set of rules. This includes filtering on numerical values, text data, Boolean values, tags, ligand structure using either a SMARTS string or a substructure sketched into the Flare Molecule Editor.
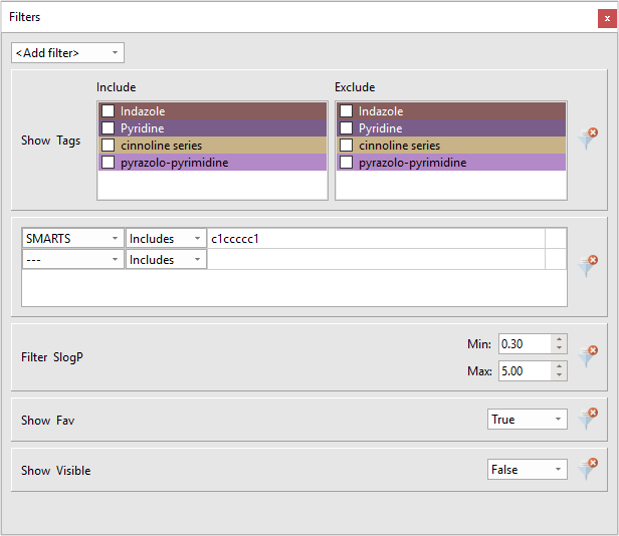
Figure 6: The Filters window in Flare V2.
Use the Storyboard window to capture and replay scenes recording all details from the 3D window. Each scene can be easily annotated and recalled when needed.
Figure 7: The Storyboard in Flare V2 showing four scenes and their titles together with notes about each scene.
 Flare Python® API
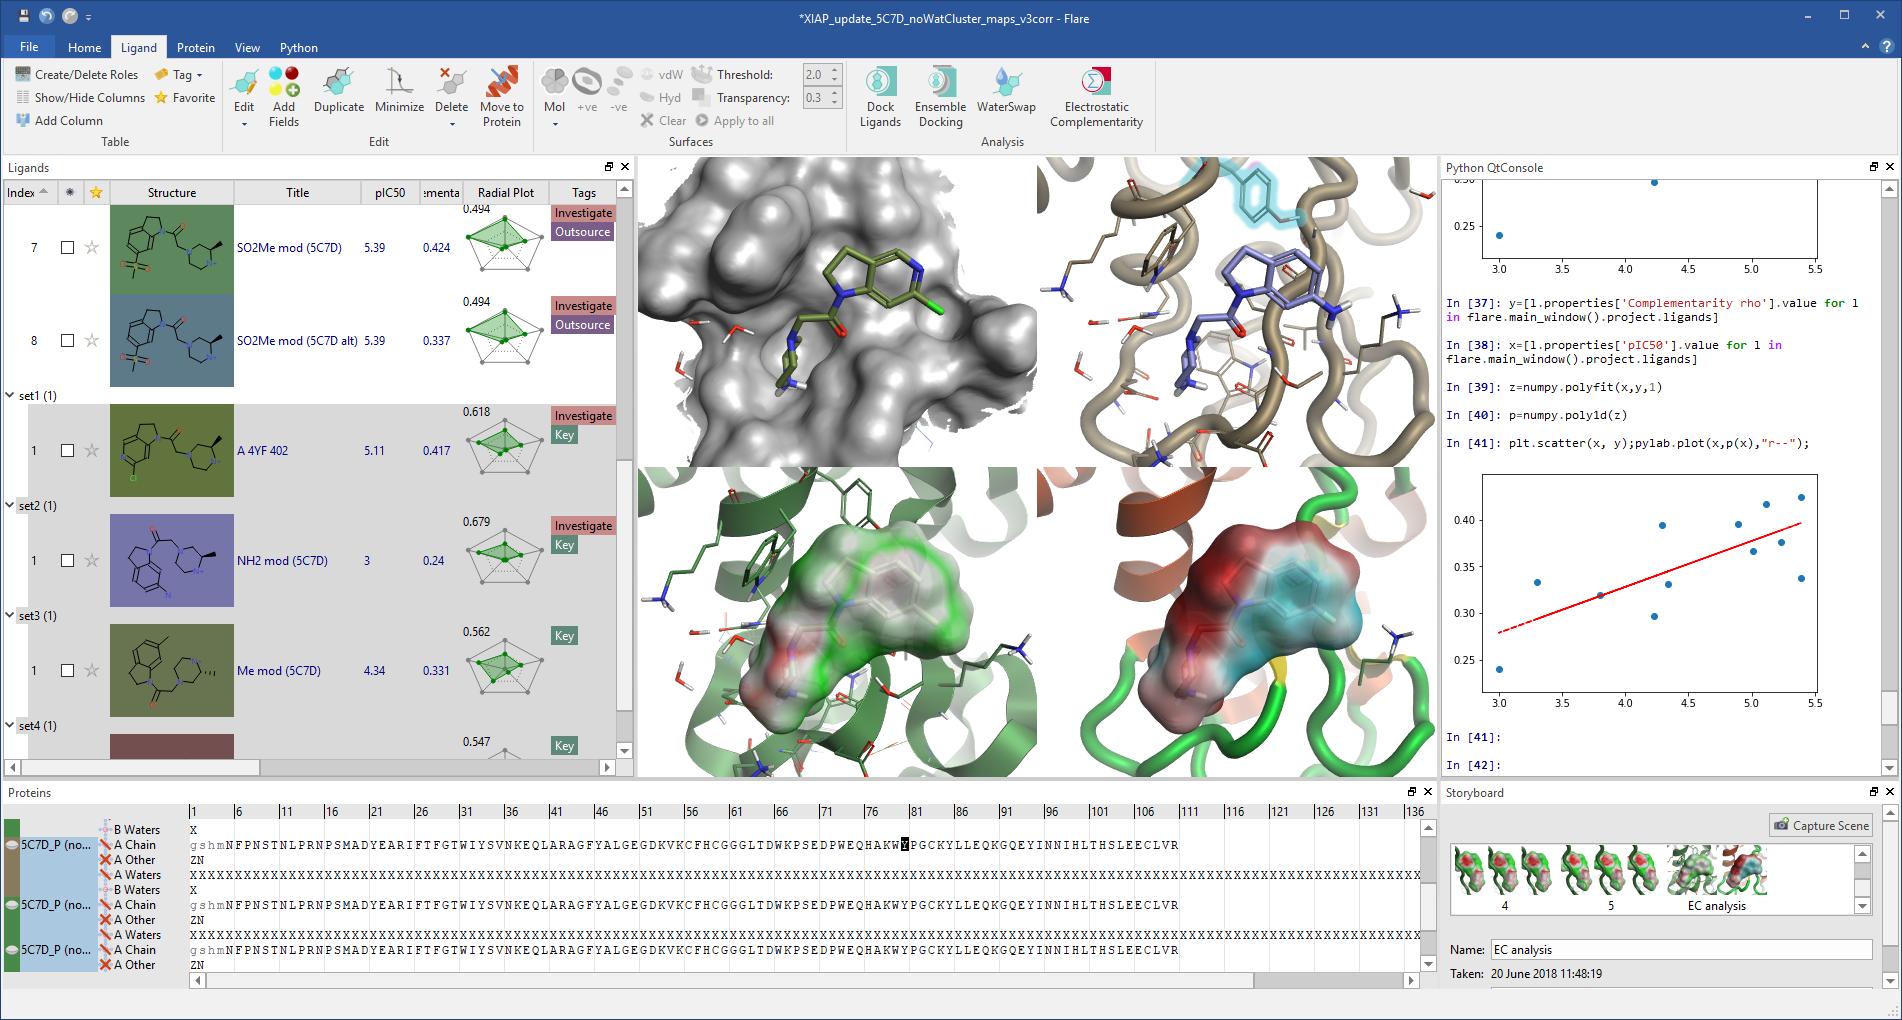
The new Python API lets you create your own workflows, automate your common tasks, expand Flare with Python modules and add custom controls. It gives full access to all of Flare’s capabilities, including the RDKit cheminformatics toolkit.
Flare can be upgraded with Python modules for graphing statistics, Jupyter® notebook integration and much more.
 |
|
Flare V2 makes advanced structure-based design techniques, such as Electrostatic Complementarity, multiparametric scoring and Python scripting, accessible through an intuitive GUI. |
With over 200 new or improved features, Flare V2 is built to make structure-based design easy and accessible while incorporating cutting edge scientific methods. I encourage you to upgrade your version of Flare at your earliest convenience.
If you are not currently a Flare customer, please request a free evaluation.
Contact us if you have queries relating to this release.