Improving PROTAC properties via single-point changes to linkers
We explore how computational methods can be applied to proteolysis targeting chimera (PROTAC) design, to effectively tackle some of the ...
News
Electrostatic Complementarity™ maps implemented in Flare™,1 Cresset’s structure-based design application, were used to investigate the protein-ligand electrostatic interactions and the Structure-Activity Relationship (SAR) of a small set of inhibitors of the X-linked IAP (XIAP)-caspase protein-protein interaction. A good correlation was also obtained between XIAP-BIR3 affinity and the Electrostatic Complementarity scores for the same data set.
Inhibitor of apoptosis proteins (IAPs) are key regulators of antiapoptotic and pro-survival signaling pathways.2-4 Their deregulation occurs in various cancers and is associated with tumor growth, resistance to treatment and poor prognosis. This makes them an attractive target for anticancer drug discovery.5-7 The best characterized IAP, X-linked IAP (XIAP), exerts its antiapoptotic activity by binding and inactivation of caspases 3, 7, and 9 via its BIR domains. Disruption of the protein-protein interaction (PPI) between XIAP-BIR domains and caspases via small molecules is a promising strategy to inhibit XIAP. However, drugging PPIs can be particularly challenging due to their unusual binding interfaces, which are unlike classical binding sites generally flat and large.8
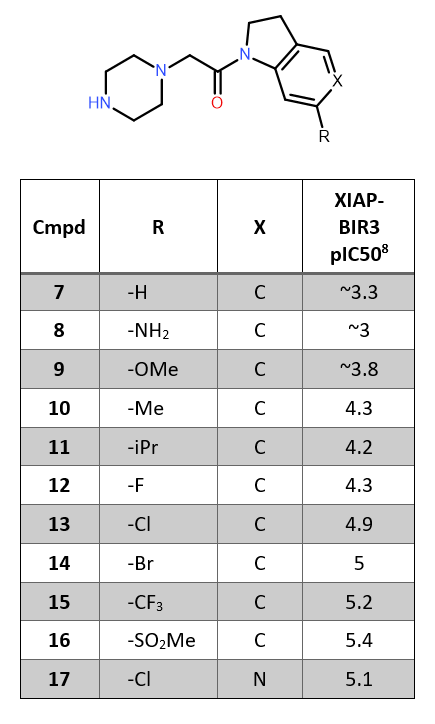
A recent paper from Astex9 reports that the XIAP-BIR3 activity of the small dataset of antagonists in Table 1 is increased by the introduction of electron-withdrawing substituents on the indoline ring, and shows a nice correlation between the XIAP-BIR3 pIC50 and Hammett’s σp.
In this case study, we used the Electrostatic Complementarity maps available in Flare to investigate the protein-ligand electrostatic interactions and the SAR of the molecules in Table 1. Electrostatic Complementarity scores calculated with Flare were used to quantitatively model XIAP-BIR3 pIC50.
Table 1. XIAP-BIR3 affinity of C-6 substituted indolines.8
The 5C7A ligand-protein complex was downloaded from the Protein Data Bank into Flare and prepared using the Build Model10 tool from BioMolTech,11 to add hydrogen atoms, optimize hydrogen bonds, remove atomic clashes and assign optimal protonation states to the protein structure. Any truncated protein chain was capped as part of protein preparation. The binding site was visually inspected to check for correct protonation states of ligands and amino acid side chains and re-optimize water orientations of suboptimal water hydrogen bonding networks. We chose to keep only water molecules in and close to the binding site that have at least 2 hydrogen bonding contacts to the protein or at least 1 hydrogen bond to ligand and protein for electrostatic complementarity calculations. As many of the modeled binding modes (e.g., compounds 9, 11, 15, 16) clash with the flexible side chain of Lys297 (Figure 1), the side chain atoms were minimized with the XED force field12 for each ligand. The resulting receptors were used to compute the electrostatic complementarity of the respective compounds.
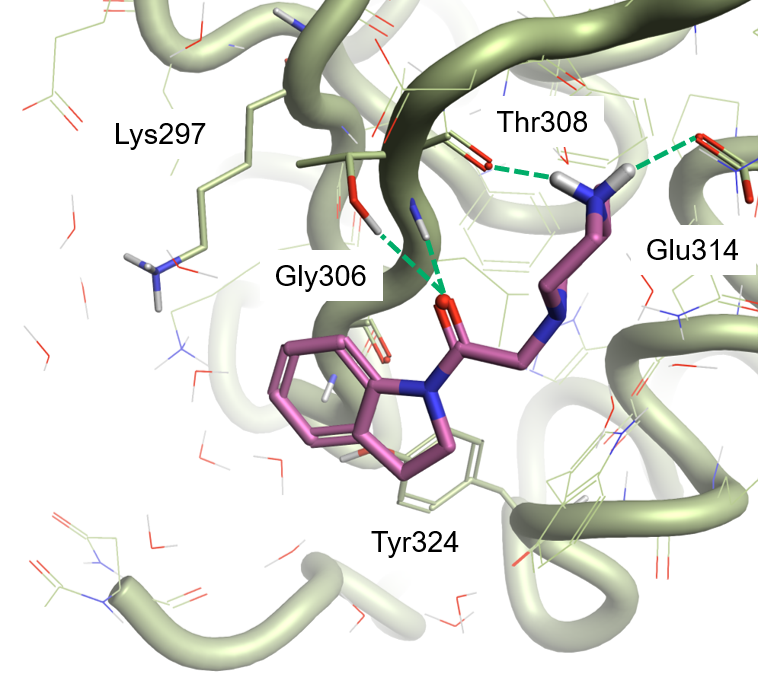
The compounds in Table 1 were drawn using the molecule editor in Flare, starting from the crystal structure of the ligand in PDB:5C7A (compound 7 in Table 1). The 11 compounds were then aligned in Forge13 to the 5C7A ligand, using a Maximum Common Substructure alignment to minimize the conformational noise in the common indoline-piperazine scaffold.
Electrostatic Complementarity maps and scoring functions are an extension of Flare’s Protein Interaction Potentials based on Cresset’s polarizable XED force field. In contrast to classical force fields that rely on atom-centered charges, XED enables description of anisotropic charge distribution around atoms which is usually only possible with ab initio approaches. Polarization effects and description of atomic charge anisotropy are especially useful for computing electrostatic properties of aromatic or unsaturated hydrocarbons, sp2 hybridized oxygen atoms, sp or sp2 hybridized nitrogen atoms, and aromatic halogens (sigma hole of Cl, Br, and I).14-16
To calculate the Electrostatic Complementarity map for a ligand towards a protein of interest, the solvent-accessible surface is first placed over the ligand. A calculation of electrostatic potentials due to the ligand and the protein is then carried out at each vertex on the surface.
These potentials are then scaled, added together, and normalized to yield the Electrostatic Complementarity score. Perfect electrostatic complementarity means that at each vertex point the ligand electrostatic potential value is paired with a protein electrostatic potential value of the same magnitude with reverse sign. Regions of the ligand surface where there is electrostatic complementarity with the protein are colored green, while the regions where there is a electrostatic clash are colored red. A more detailed description of the electrostatic potential and complementarity methodology will be presented elsewhere.17
The Electrostatic Complementarity scores quantify the ligand-protein electrostatic complementarity with three different metrics suitable for diverse protein-ligand scenarios.
The first computed score (‘Complementarity’) is the normalized surface integral of the complementarity score over the surface of the ligand (effectively the average value of that score over the surface of the ligand).
The other two scores (‘Complementarity r’ and ‘Complementarity rho’) are the Pearson’s correlation coefficient and the Spearman rank correlation coefficient, respectively, which are computed on the raw ligand and protein electrostatic potentials sampled on the surface vertices.
All three measures range from 1 (perfect complementarity) to -1 (perfect clash) but have different characteristics. The Complementarity score includes some compensation for desolvation effects, and so may be more robust when these are significant. The Pearson and Spearman correlation coefficients can provide a better indication of ligand activity in some cases, but are more susceptible to noise (r more than rho). The Spearman’s rho number is more robust against background electric fields, which may be useful if the computed protein electric potential is being biased by a large net charge on the protein.
The calculation is fast and predictive: scoring a hundred ligands normally takes less than a couple of minutes on an average laptop and gives important insights into protein-ligand electrostatics, which typically correlate with compound activity.
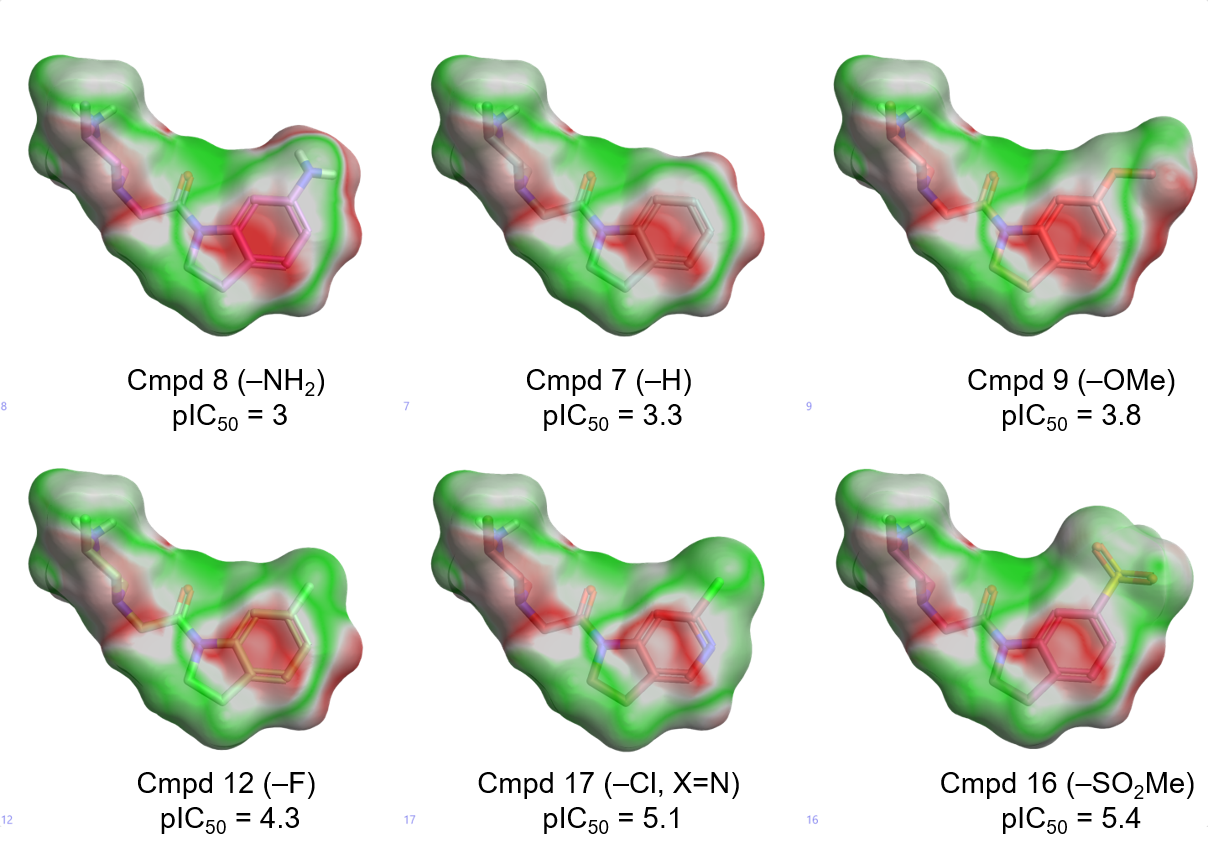
The Electrostatic Complementarity map of compound 7 in the XIAP active site (PDB: 5C7A, Figure 2 – left) shows a strong electrostatic clash (red) in the region above the indoline ring. This is caused by an area of negative electrostatic potential in the protein’s active site, generated by the backbone carbonyl of Gly306 and the phenolic oxygen of Tyr324 (Figure 2 – middle), clashing with the negative electrostatic field associated with the indoline ring (Figure 2 – right). A less pronounced electrostatic clash can be seen between the positive electrostatic field of the protonated side chain of Lys297 (Figure 2 – middle) and the positive electrostatic field of the sigma hydrogens of the indoline ring (Figure 2 – right).
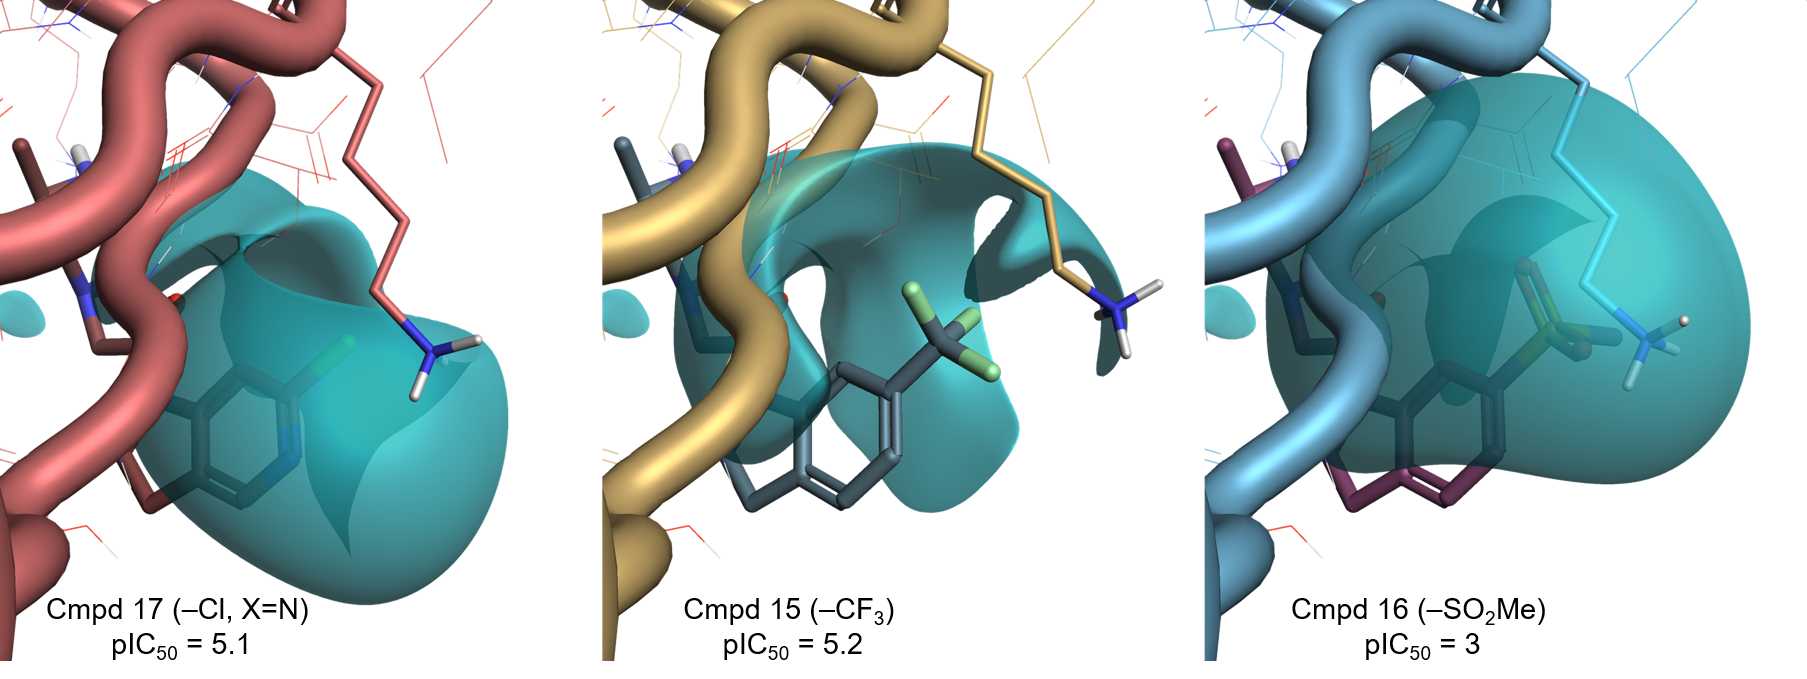
According to this map (and in agreement with the reported correlation8), electron-withdrawing substituents which make the indoline ring less electron-rich are expected to increase XIAP binding. Substituents associated with a more negative (or less positive) electrostatic field, favoring the interaction with the protonated side chain of Lys297, should also be beneficial.

Figure 3 shows the Electrostatic Complementarity maps for the compounds in Table 1, shown in order of increasing XIAP-BIR3 activity from left to right.
A clear trend can be observed as we move from the electron-donating substituents (-NH2, -OMe), to the electron-withdrawing substituents -F, -Cl, -SO2Me. These make the indoline ring less electron-rich, reducing the clash with the negative electrostatic of the XIAP active site.
The substituents for the three most potent compounds are also associated with a negative ligand field of their own (Figure 4), favoring the interaction with the protonated side chain of Lys297, according to our initial hypothesis.
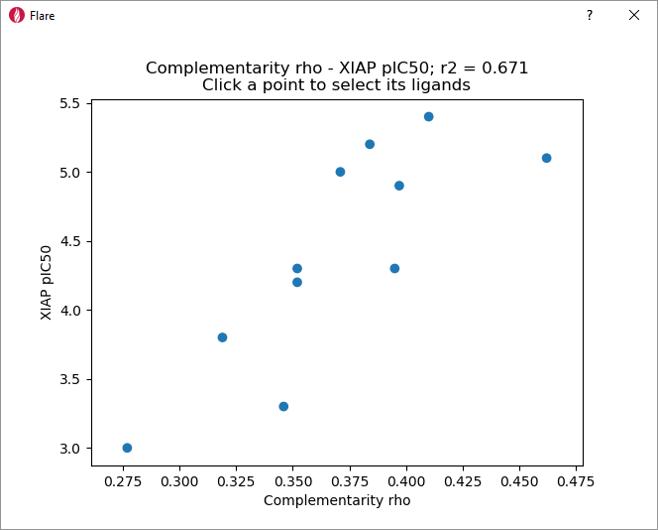
These qualitative observations are confirmed by the nice correlation (r2 = 0.671) between XIAP-BIR3 pIC50 and the ‘Complementarity rho’ score shown in Figure 5.
We monitored the correlation between MW and XIAP-BIR3 affinity/Complementarity rho to verify whether the Electrostatic Complementarity scores provide information which goes beyond the use of simple physico-chemical descriptors for drug design.
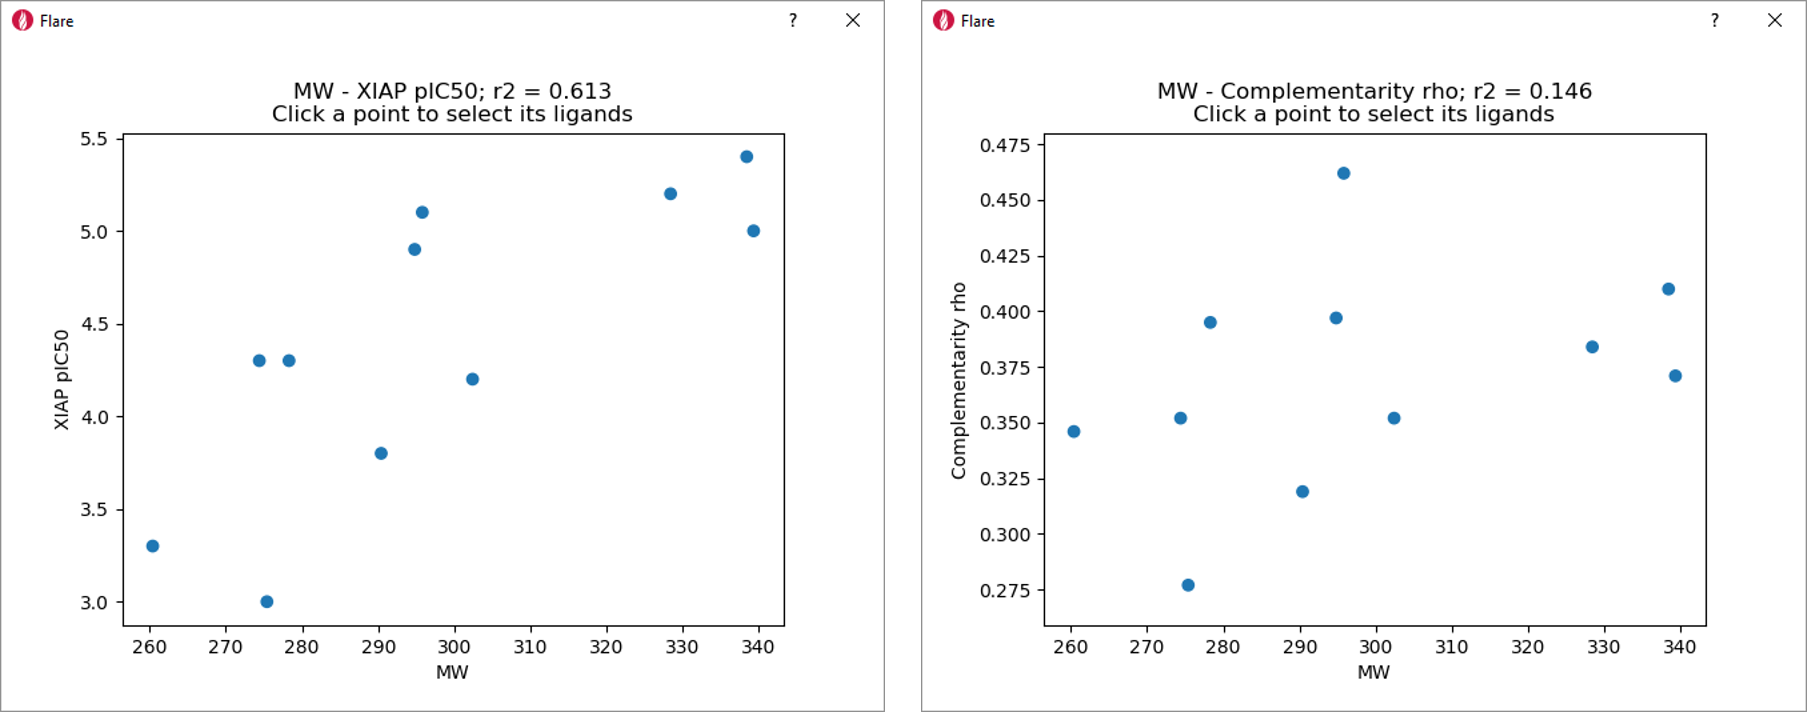
The correlation between MW and XIAP-BIR3 pIC50 (r2 = 0.613, Figure 6 – left), would possibly point towards a space filling effect as the simplest explanation of the changes in XIAP affinity in this data set.
However, the low correlation between Complementarity rho and MW (Figure 6 – right) confirms that the Electrostatic Complementarity scores are size independent.
Using the Electrostatic Complementarity scores for quantitative SAR modeling, therefore, generates trends completely independent from size effects.
Furthermore, Electrostatic Complementarity maps provide visual insight into ligand-protein binding and SAR which cannot be derived from traditional, simple physico-chemical descriptors such as MW and Hammett’s σp, thus providing invaluable information for drug design.
Application of Electrostatic Complementarity to a reported XIAP-BIR3 data set showed that our method can detect and quantify electrostatic differences in XIAP ligands that cause changes in bioactivity. Electrostatic Complementarity scores and maps in Flare V2, based on Cresset’s polarizable XED force field, provide rapid activity prediction with visual feedback on new molecule designs. They provide useful information for understanding ligand binding and SAR and can be used for rapidly ranking of new molecule designs.