Improving PROTAC properties via single-point changes to linkers
We explore how computational methods can be applied to proteolysis targeting chimera (PROTAC) design, to effectively tackle some of the ...
News
We are pleased to announce the introduction of Flare Viewer, a free licensing option of Flare, our structure-based design application. With Flare Viewer you can easily visualize and analyze your protein-ligand complexes, use our proprietary electrostatics to design new ligands, and communicate your ideas with high quality graphics and pictures.
Read in protein-ligand complexes by opening a file in a local or remote disk location, downloading multiple entries from the Protein Data Bank, or by drag-and-drop from your desktop if you are a Windows user. Ligands can be moved into the dedicated ligands table by drag-and-drop, with each ligand keeping the association with the protein it belongs to. Here they can be easily organized into custom groups, to keep your project tidy.
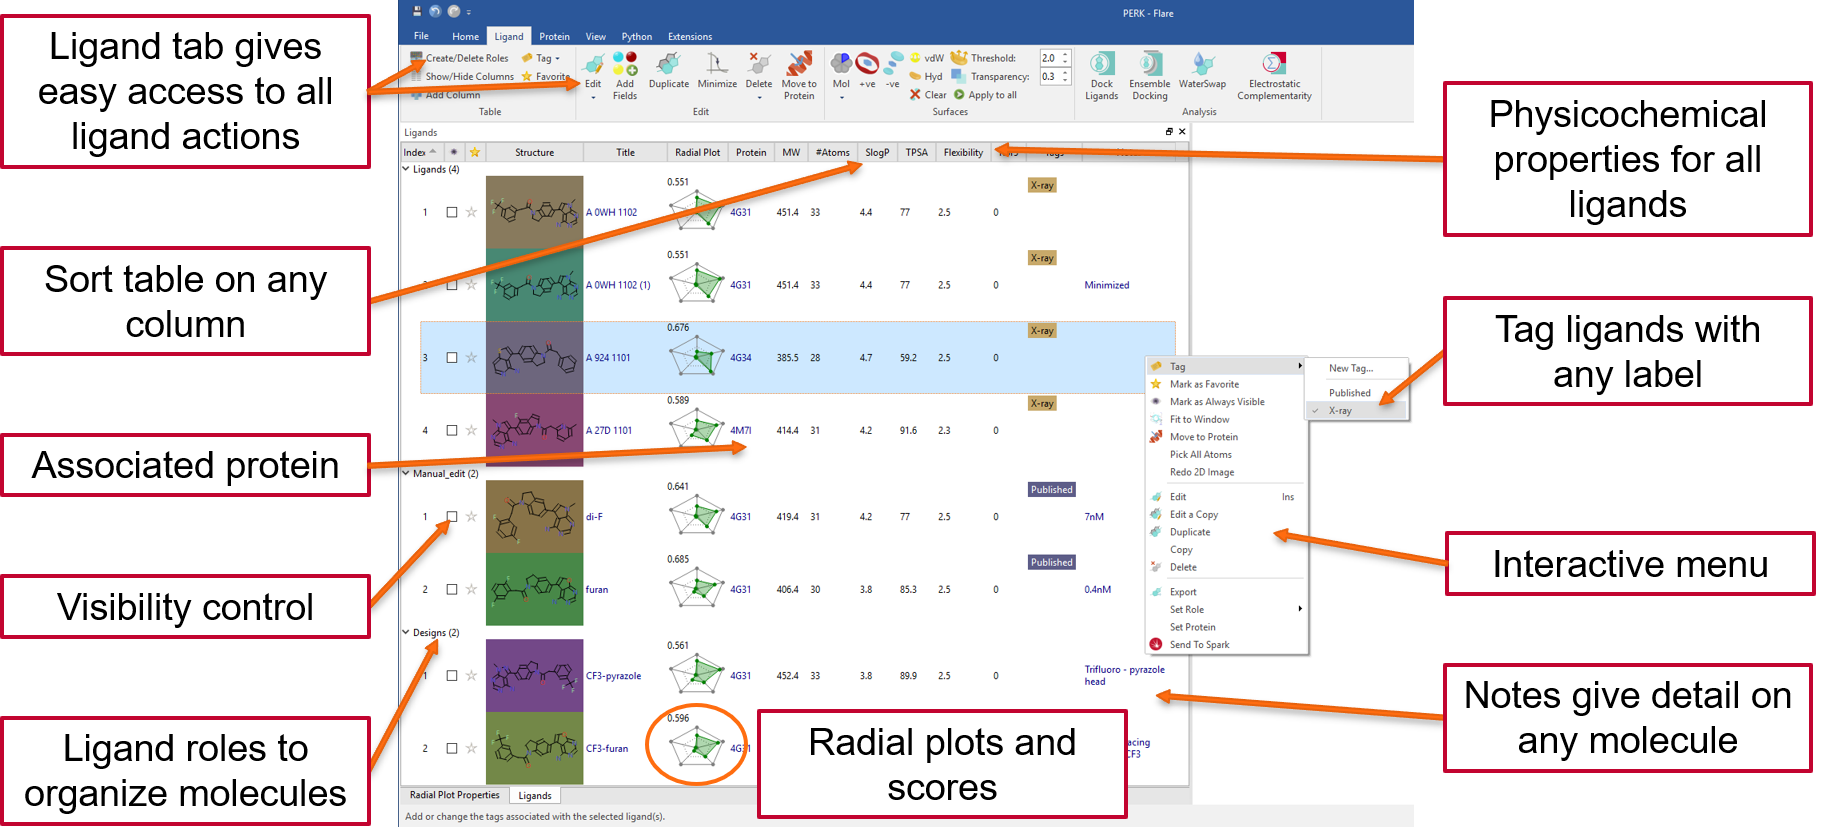
The dedicated ligand table and interactive menu gives easy access to all ligand actions: for example, sorting on any column, control visibility, tagging and filtering on structure, tags and numerical and text columns. A physico-chemical profile is calculated for every ligand and summarized in a fully customizable radial plot and multi-parametric score to help you design and select the ligands with the best fit to your ideal project profile.
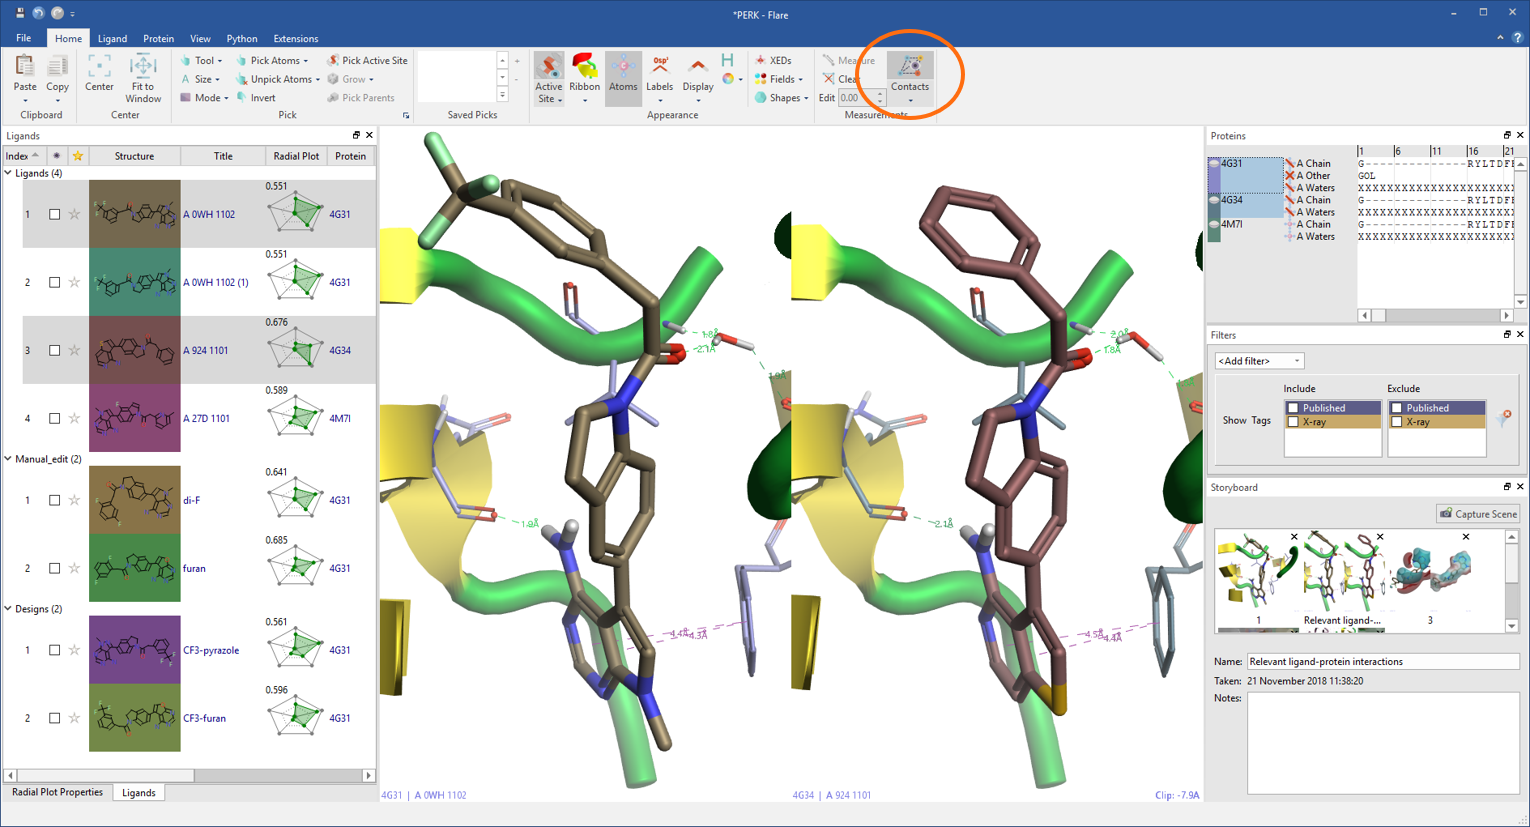
Flare calculates and displays a variety of ligand-protein interactions. These include H-bonds, steric clashes, aromatic-aromatic, cation-pi interactions and more, also including water-mediated and intra-molecular interactions as an option.
Each ligand can be displayed with its associated protein in grid mode making comparisons between ligands or proteins straightforward.
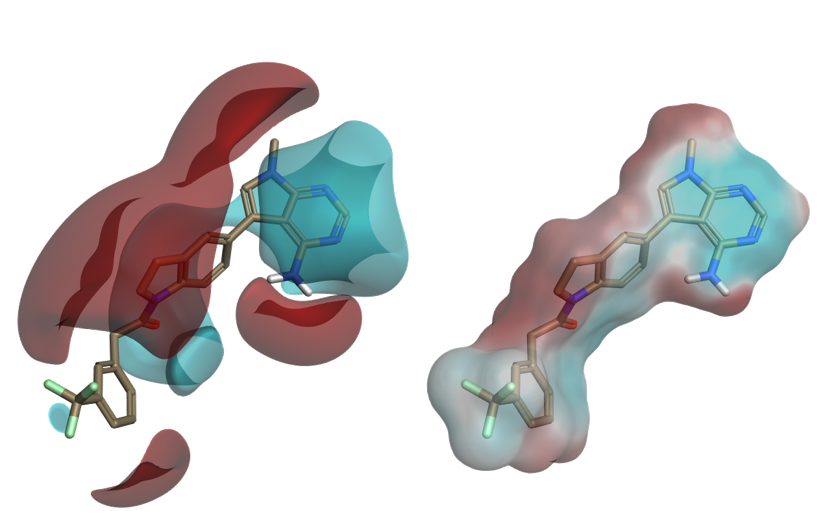
Understanding ligand electrostatics is key in the design of improved ligands. In Flare, electrostatic interaction potentials calculated with the Cresset XED force field can be visualized as ligand fields or by mapping the electrostatic potential onto the ligand’s molecular surface.
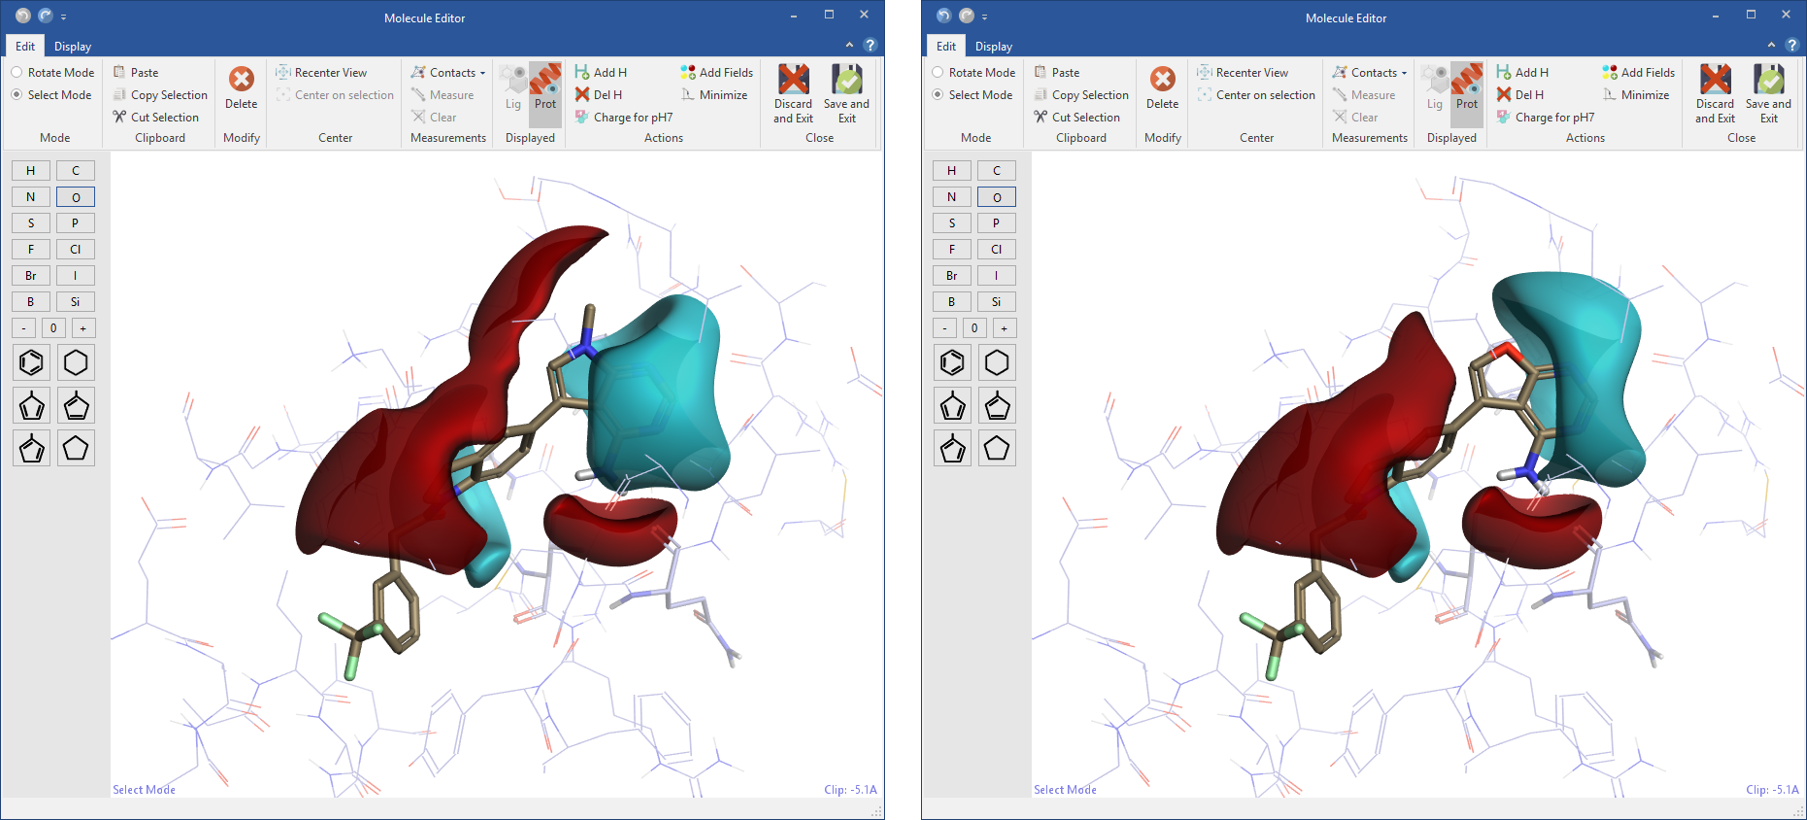
Designing new ligands in Flare gives you immediate feedback on electrostatic changes in the context of the protein active site. In the molecule editor, the ligand or a selected part of the ligand can be minimized ensuring bonds, angles and torsions have low energy values.
Multiple protein structures can be imported in the same project and displayed in the same frame of reference using the sequence alignment and superimposition functions in Flare. You can choose the protein to superimpose to, whether all proteins are to move and if all residues or selected residues are superimposed. The protein structure can be optimized by flipping flexible residues or changing tautomeric and charge states for relevant residues.
Once opened, the proteins will sit in a dedicated table where all their components (chains, ligands, crystallographic waters and cofactors) are clearly visible, enabling a rapid inspection of specific chains or residues.
Protein surfaces can be displayed and colored by solid color, atom, secondary structure and hydrophobicity, and saved in a dedicated protein surface window.
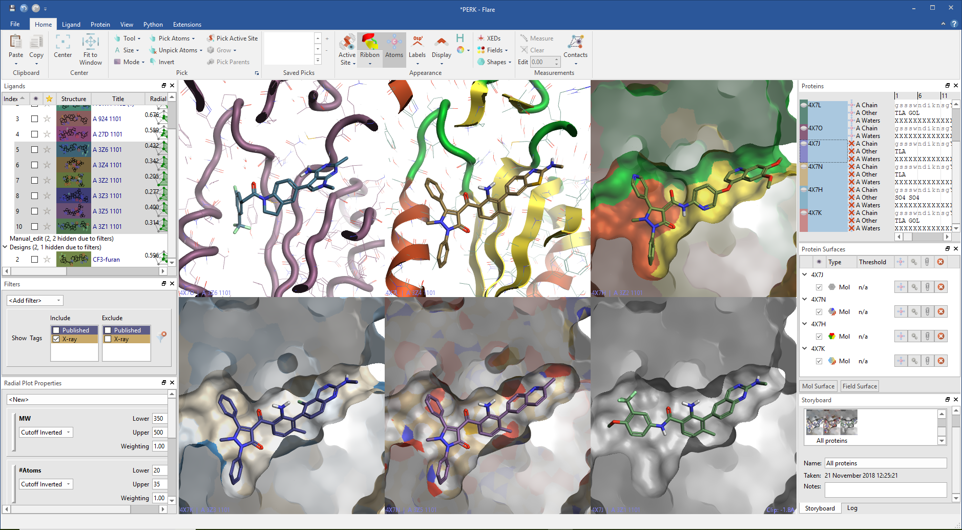
Important scenes can be captured and annotated in the Storyboard to be recalled when needed. Images can be easily copied and exported, with many options to configure the image or file size.
A dedicated extended atom picking widget enables complex queries and gives you full control on what is selected and displayed in the 3D window.
The ribbon menu structure of Flare makes it easy to identify the commands and controls you are looking for, as all actions are always visible and organized in a logical structure.

Upgrading Flare Viewer to include the Flare Python API will enable you to create your own workflows, automate common tasks, add custom controls and context menus, access Python modules such as the RDKit cheminformatics toolkit, NumPy, SciPy, and Matplotlib. We also provide a collection of featured python extensions that extend the existing Flare functionality.
See the features of Flare Viewer, and download your free 1 year license.
Bespoke free licensing options for academic users are also available; see the announcement.