Improving PROTAC properties via single-point changes to linkers
We explore how computational methods can be applied to proteolysis targeting chimera (PROTAC) design, to effectively tackle some of the ...
News
At Cresset, we enjoy seeing our products work in synergy. By combining the most recent scientific methods and workflows we deliver solutions to address molecule design challenges. In this post, we use the new Electrostatic Complementarity™ (EC) maps and scores in Flare to help the post-processing of a Spark macrocyclization experiment.
In the case study Using Spark to design macrocycle BRD4 inhibitors, we used Spark, our bioisostere replacement and scaffold hopping tool, to design macrocyclization strategies for non-macrocyclic, pyridone BRD4 inhibitors and evaluate results against experimental data reported by Wang et al [1]. The results showed that Spark successfully reproduced the experimental data.
In a real drug discovery project where no retrospective data is available, it would be useful to have criteria based on the existing knowledge of the system under study helping a further post-processing of the Spark results. Here we show how to use Spark in synergy with the EC maps and scores in Flare, our structure-based design tool, to pick the most promising candidates for synthesis.
Electrostatic interactions are essential for molecular recognition and are also key contributors to the binding free energy ΔG of protein-ligand complexes. Assessing the electrostatic match between ligands and binding pockets provides important insights into why ligands bind and what can be changed to improve binding.
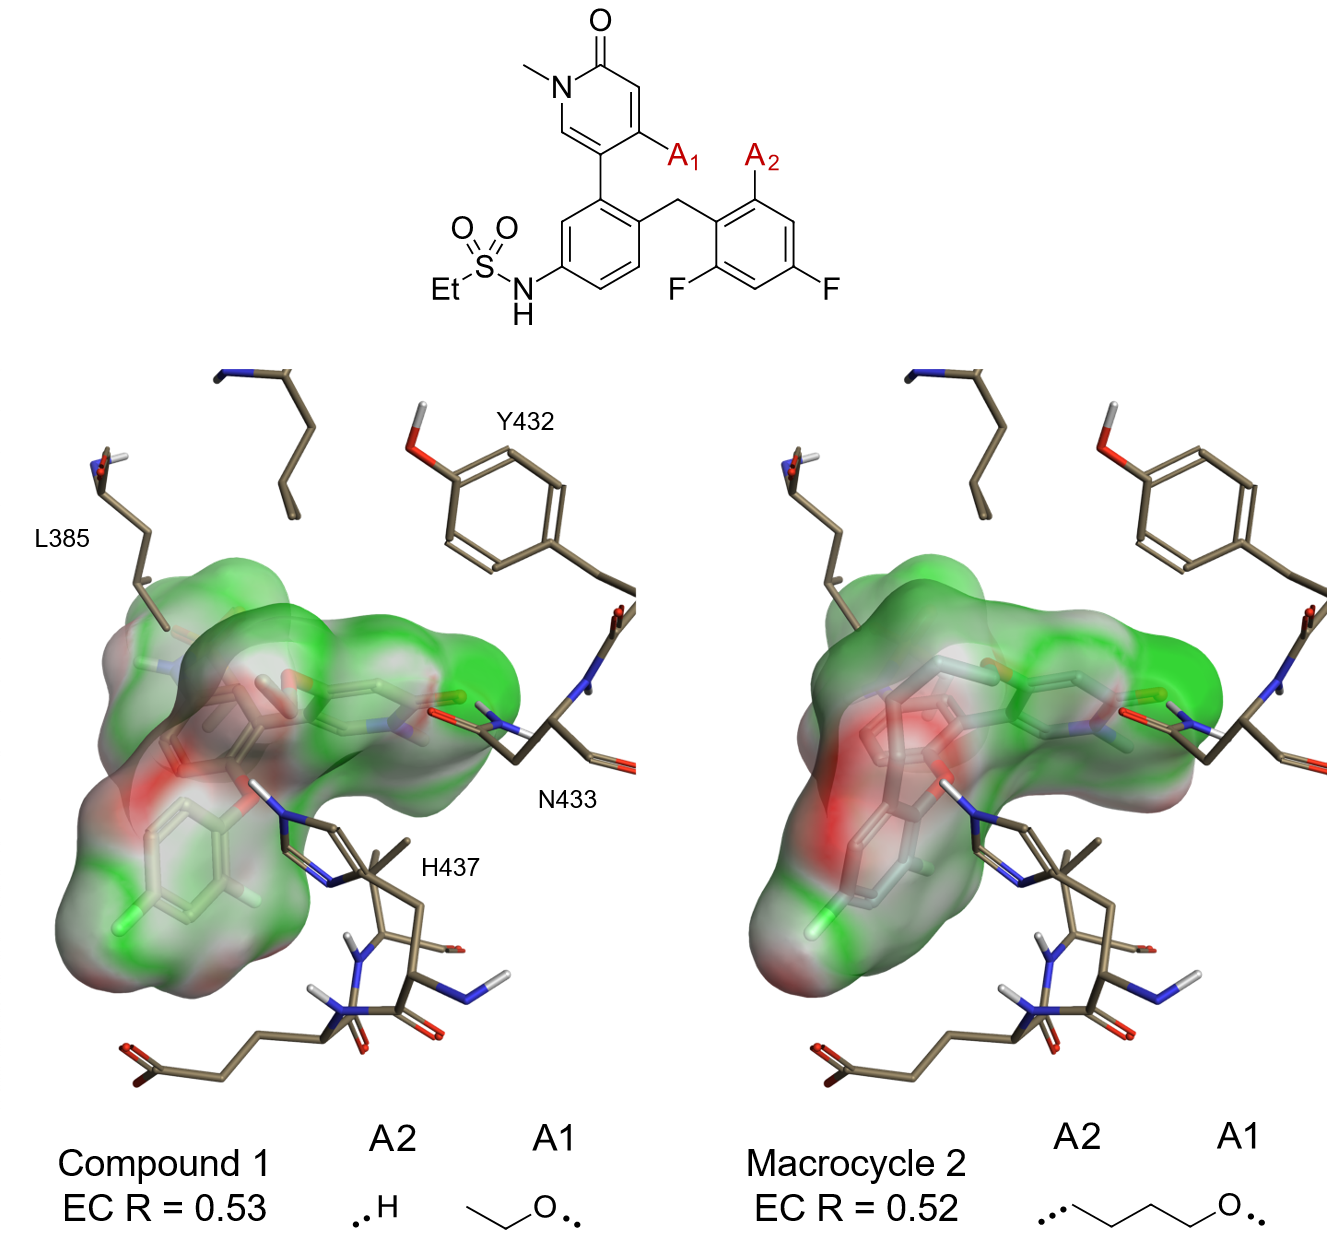
The 100 top scoring results from the BRD4 Spark experiment were opened in Flare using the ‘Send to Flare’ functionality in Spark, which also transfers the related starter molecule (compound 1 in Figure 1) and excluded volume protein (5UEY). The protein was prepared in Flare, removing the water molecules that do not make clear interactions with both the ligand and protein. EC scores and maps were then calculated for compound 1 and the experimentally validated macrocycle 2 reported by Wang et al. towards the same 5UEY protein, as shown in Figure 1. As expected, the EC maps for both compounds show good complementarity to the protein and a very similar EC R score of 0.52/0.53 (Pearson’s r correlation coefficient). Spark linkers showing similar (or better) maps/score should provide interesting ideas for synthesis.

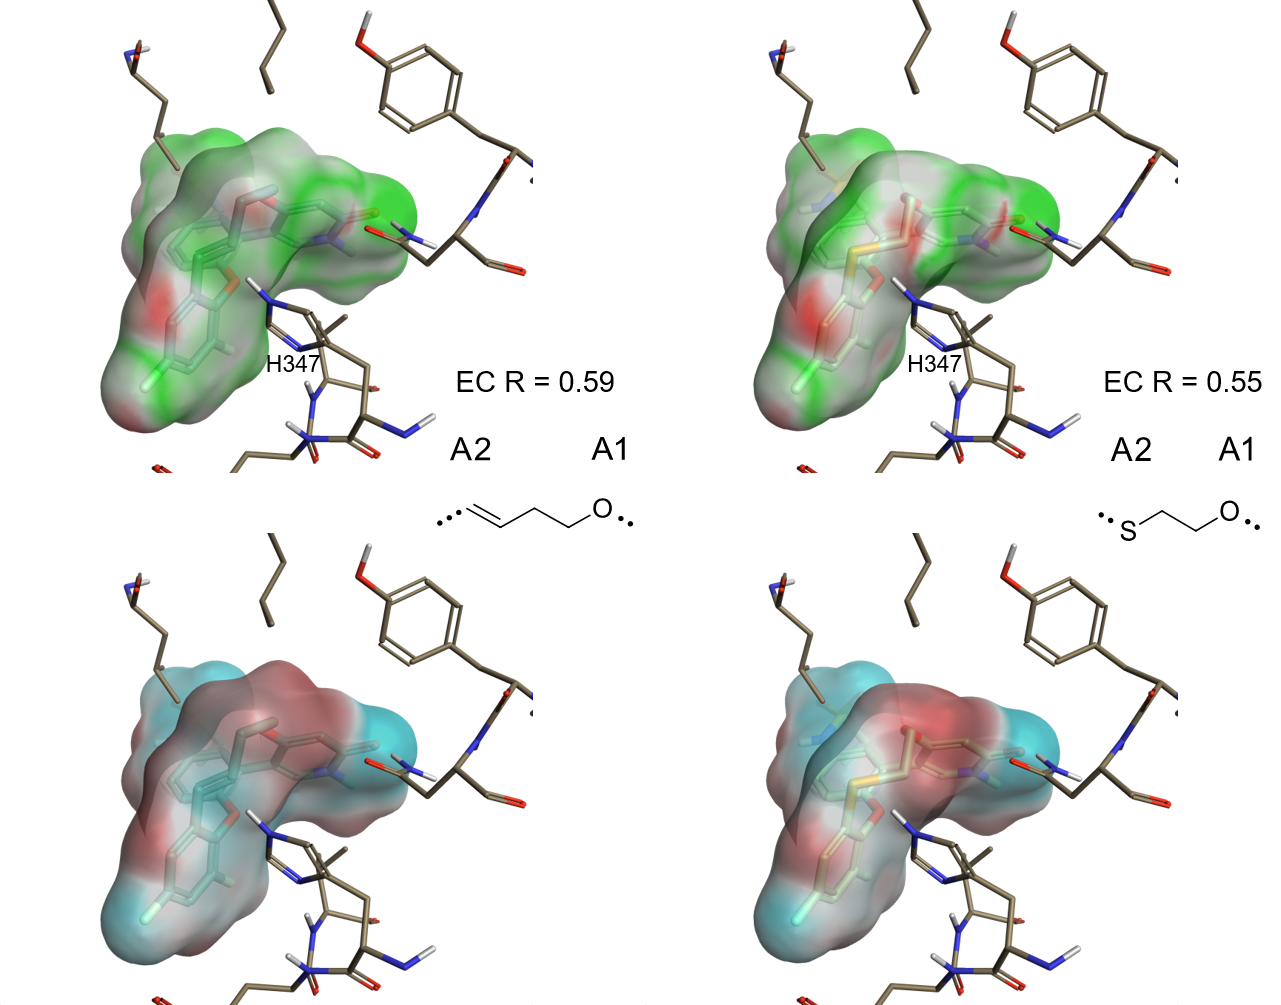
Figure 2 shows a couple of the most interesting linkers in terms of EC score.

In the first example (Figure 2 – left), the π-system in the double bond linker complements the positive electrostatic field at the NH proton of His437 better than compound 1 or a fully saturated linker of similar length, as in macrocycle 2.
Another interesting example of good electrostatic match is the mercaptoethanol linker (Figure 2 – right). The negative electrostatic field of the thioether group is also in close proximity to the polarized NH of His437.
For both compounds, the increase in EC towards the protein is due to the introduction of a more negative ligand electrostatic in the region near His437, as shown by the electrostatic potential maps for both linkers (Figure 2 – bottom).
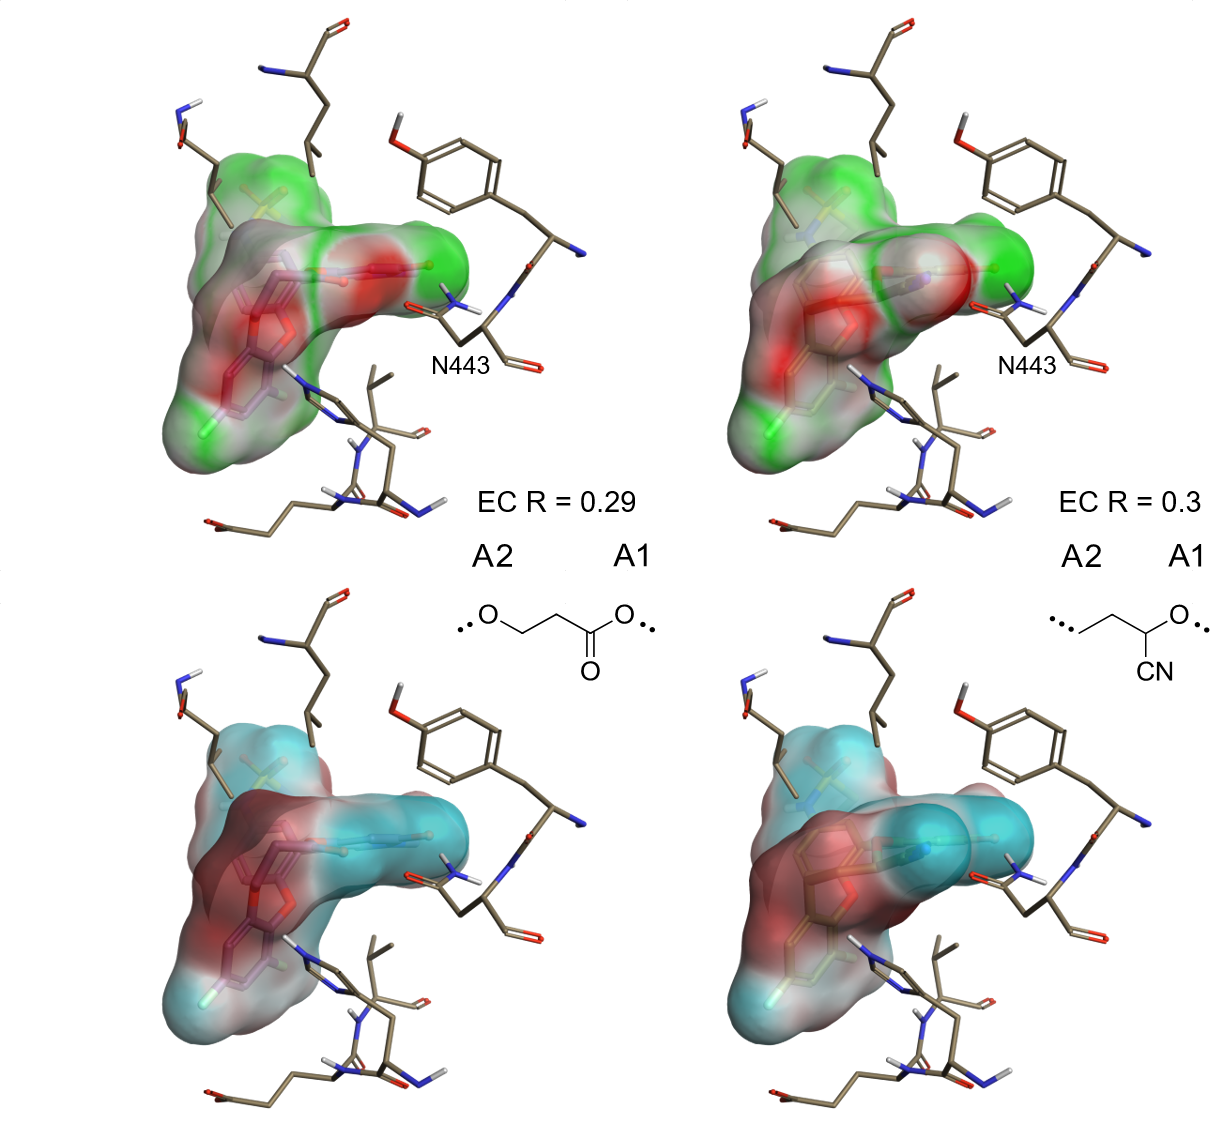
In contrast, an analysis of the EC maps for two of the linkers with the lowest EC scores (Figure 3) immediately highlights the reasons why these should be down-prioritized.

These linkers expose an area of negative interaction potential towards the carbonyl of Asn443, resulting in a strong electrostatic clash.
Are you surprised that a few linkers with low EC ended up among the top 100 scoring Spark results? Don’t forget that Spark works on ligand similarity. In macrocyclization (and fragment linking) experiments we are stretching the method to explore regions in space where ‘no ligand has gone before’.
In such cases, adding protein information is clearly highly beneficial to help post-processing. EC maps in Flare are an intuitive visual method for rationalizing the choice of the best ideas to progress, while EC scores provide a rapid way of scoring and filtering the 500 Spark results in just a few minutes.
To try Spark or Flare on your projects, request your free evaluation.