Future-proofing Cybersecurity in Drug Discovery
The pharmaceutical and biotech sectors suffer more data security breaches than any other industry, with 53% resulting from malicious activity. To protect against potential ...
News
Electrostatic Complementarity (EC) is a popular method within Flare™, Cresset's comprehensive platform for ligand-based and structure-based drug design. The basic idea is quite simple: the maximum electrostatic affinity between the ligand and the receptor is achieved when the electrostatic potentials of the ligand and the receptor match (that is, have the same magnitude and opposite sign). At first glance that seems obvious. At second glance it seems a bit more surprising – why wouldn’t it be a good idea to have an even larger potential on the ligand to make the interaction energy even better? The reason is that the improved electrostatic interaction energy between the ligand and the protein will be cancelled out by the increase in desolvation penalty for the ligand.
So, all we need to do is to compute the electrostatic potential of the ligand and the protein over a suitable contact surface, and then compute some sort of correlation metric to measure how similar they are. In a vacuum, this calculation would be quite straightforward. Unfortunately, water (as usual) makes everything much more complicated. In the absence of running long dynamics simulations, we’re going to have to approximate the solvent effects somehow. I’m not a great believer in continuum solvent approximations for this purpose, as water in and around a protein active site is very far from being a continuous dielectric. However, we must do something to account for the water. Our answer is a mix of a complex dielectric function and special treatment of formal charges.

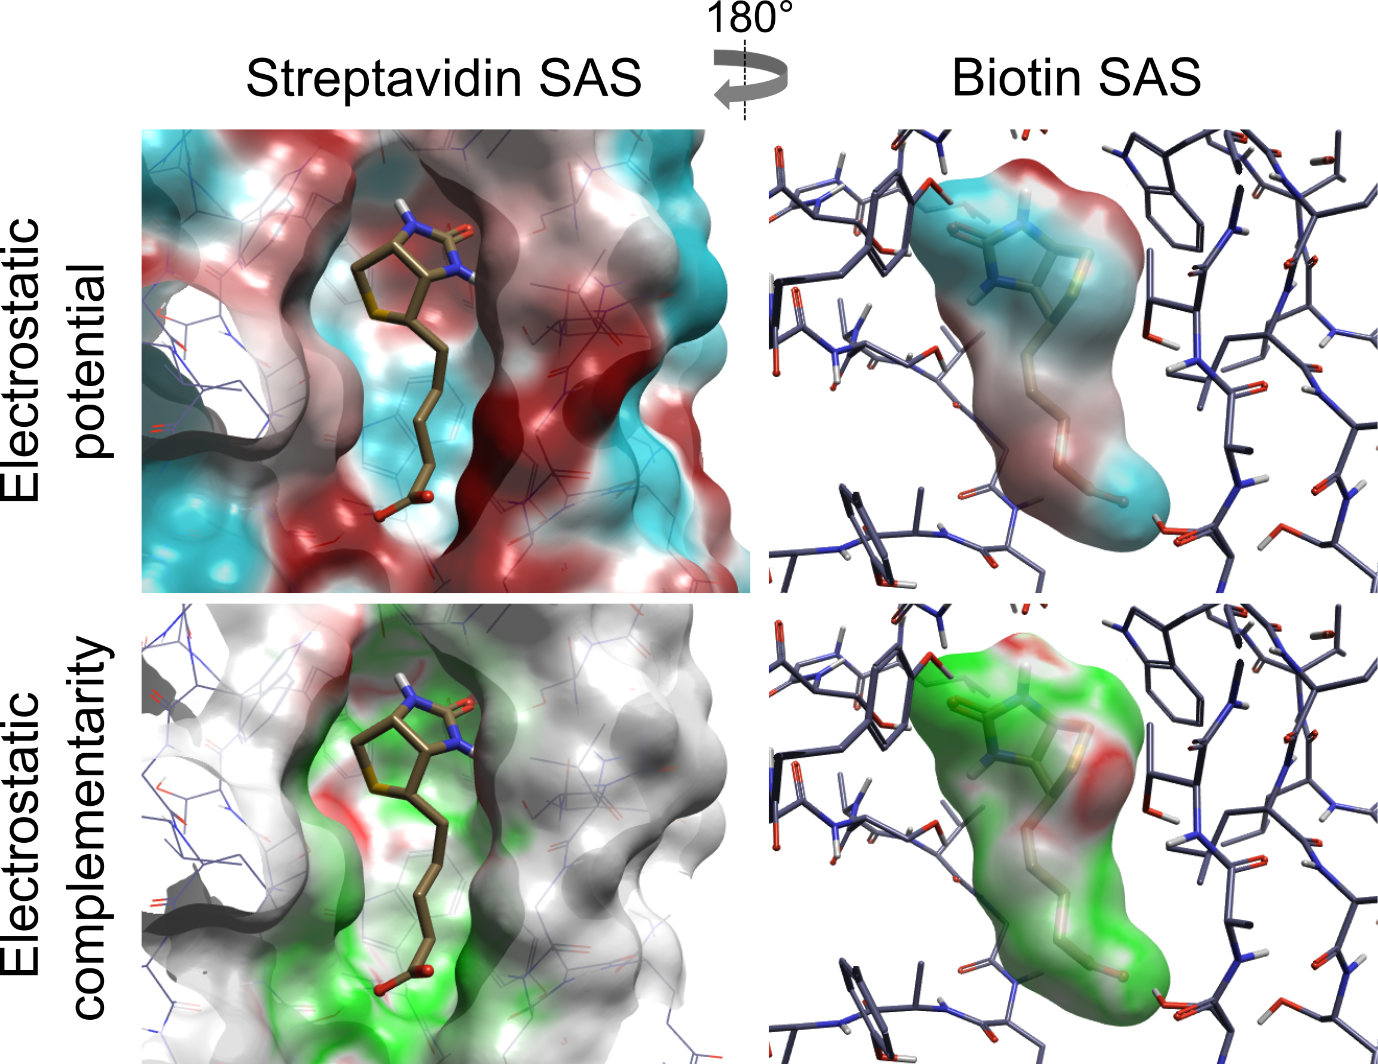
Figure 1: Electrostatic potentials and surface complementarity for the biotin-streptavidin complex.
So, we can compute the potentials (J. Med. Chem., 2019, 62 (6), pp 3036–3050), we can visualize them by coloring the surface by the complementarity (Figure 1), and we can compute an overall EC score. The question now is ‘Does it actually do anything useful?’.
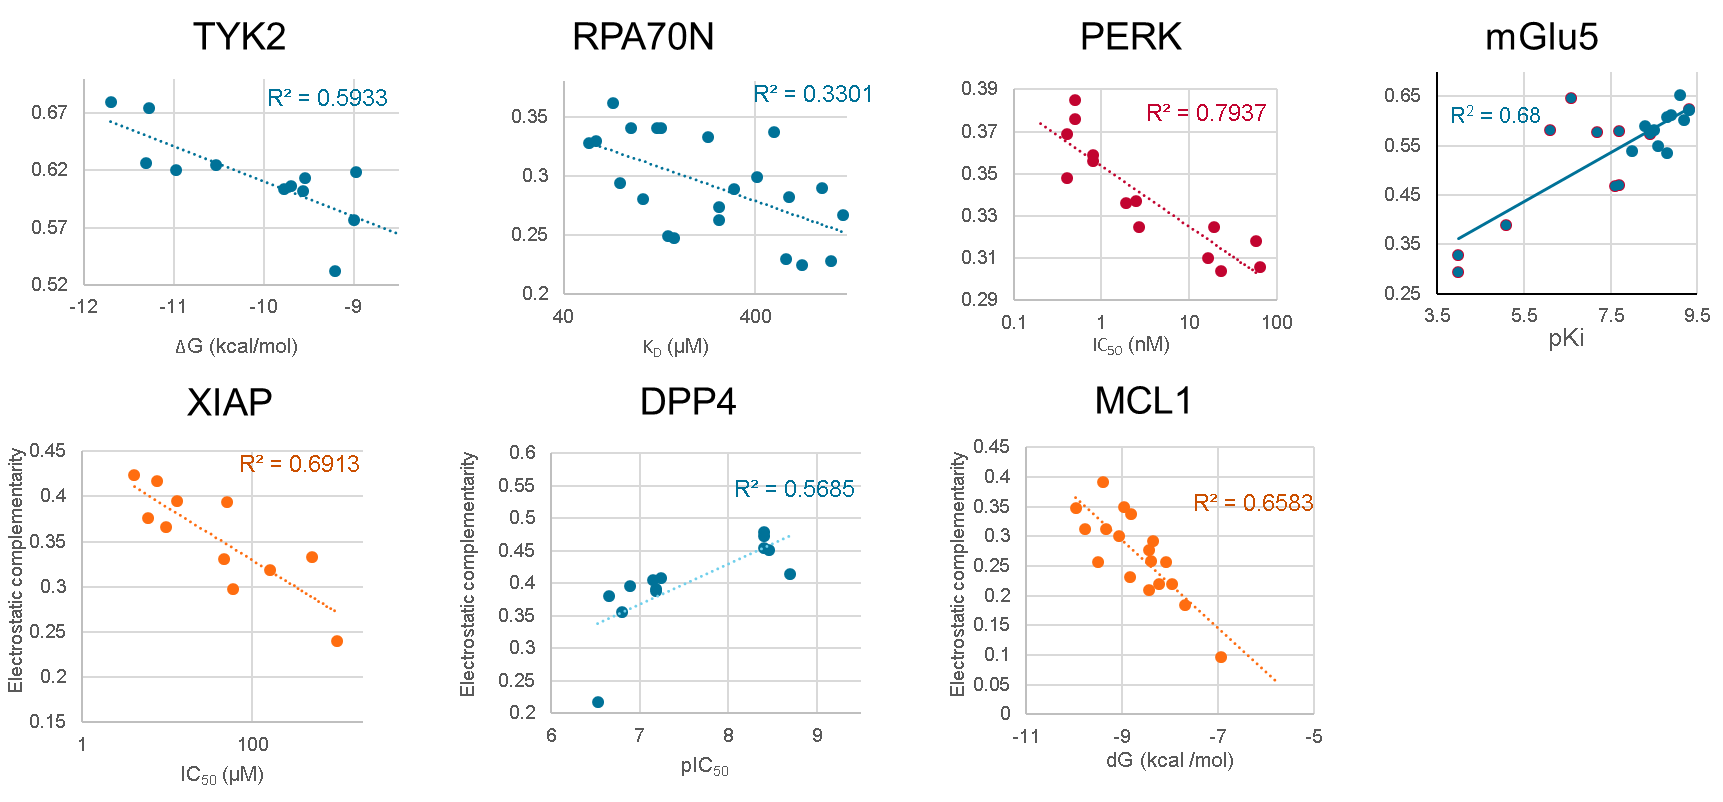
Well, we’re computing an overall EC score, so the obvious thing to check is if the score correlates with activity. We have done this for lots of data sets (see Figure 2 and the J Med Chem paper referred to earlier), and you get anywhere from a modest (r2=0.33 for RPA70N) to very good (r2=0.79 for PERK) correlation. Problem solved, then: just dock your ligand designs into your protein, compute EC scores, and pick the one with the highest EC score to make!
 Figure 2: Correlation of EC scores with activity for a range of data sets.
Unfortunately, it’s not actually that simple. While we do show that EC score correlates with activity for a wide variety of data set on different targets, these data sets are very carefully curated. The reason is that the binding of a ligand to a protein depends on many different physical effects. Electrostatics is one of these, and a very important one, but it’s not the only one, so EC score is only going to predict activity differences where the other effects do not change.
The data sets used to get the correlations in Figure 2 are very conservative: the ligands within each set are all very closely related, they are all very close to the same size, they have much the same number of rotatable bonds, they have consistent binding modes, and so on. In addition, we find that to get a strong correlation you need to minimize alignment noise (much as you do when generating a good 3D QSAR), so we align all the ligands on a common substructure rather than relying on a free dock.
All other things being equal, then, a higher EC score should give you a higher affinity. Unfortunately, in the real world, all other things are rarely equal, and so unless you are looking at quite conservative changes (for example asking where on my ligand I could substitute a fluorine to improve affinity) the EC scores are likely to be a poor guide. Back to the original question, then: ‘Does it actually do anything useful?’.
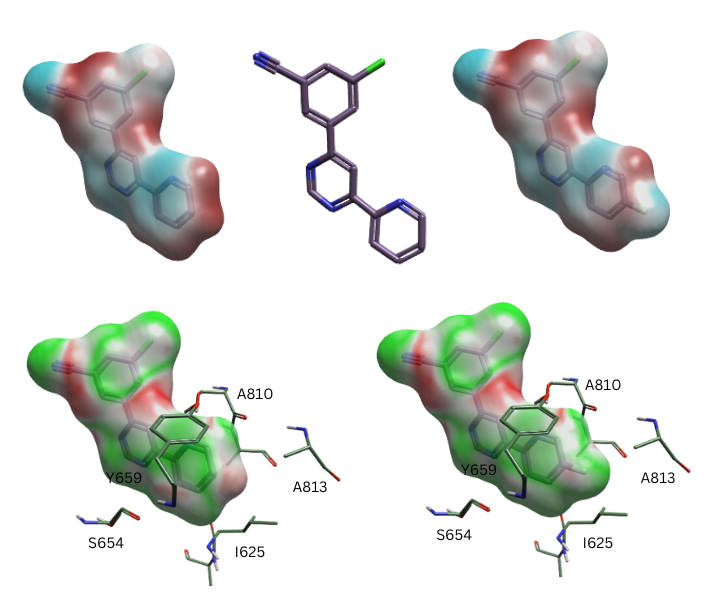
Luckily, although the single numeric EC score is very sensitive to placement of the molecule in the active site, the distribution of EC values over the surface is much more robust. The primary use of the EC method isn’t the calculation of scores: it’s the visualization of where your molecule is matching the protein electrostatics well, and where it isn’t matching as well (Figure 3). This gives you hints as to where you might want to make changes to your molecule, and what changes you might want to make: add a halogen? Move a nitrogen in a heterocycle? Small electrostatic interactions to halogen atoms or to the edges of aromatic rings are hard to visualize any other way.

Figure 3: The mGLU5 inhibitor on the left has a minor electrostatic clash on the pyridine ring, as seen in the EC surface coloring on the left. Placing a fluorine in this position removes the clash and improves affinity.
The primary use of the EC method, then, is analyzing your ligands and pointing out where improvements can be made. You can be confident that these suggestions are sensible, as we have shown in multiple data sets that where the difference between ligands is primarily electrostatic the EC score correlates with affinity. However, the EC scores themselves aren’t a general predictor of affinity, as there are many factors not included in the score that can make a molecule a better or worse binder.
If you’d like to visualize the electrostatics of your molecules in their active site and get guidance on how to improve them, request a free evaluation of Flare.