Improving PROTAC properties via single-point changes to linkers
We explore how computational methods can be applied to proteolysis targeting chimera (PROTAC) design, to effectively tackle some of the ...
News
I am delighted to announce the availability of Forge™ V10.6, our powerful computational chemistry suite for understanding structure-activity relationship (SAR) and new molecule design. The focus of this release is on new and improved methods to generate robust Quantitative Structure-Activity Relationship (QSAR) models with strong predictive ability.
Project chemists generally know which molecules they can make with a reasonably good chance of them being active. They often have too many clever ideas and are looking for ways of filtering and prioritizing lists of tangible compounds, arrays and small libraries.
Having a predictive QSAR model is a terrific way of doing this – you send your molecules into the model and get immediate feedback on whether making a compound is a good or bad idea.
However, getting a robust, predictive QSAR model is not always straightforward, and this is still a pain point for many of our users. You need a training data set of reasonable size, good activity data (e.g., pKi, pIC50) spanning a sufficiently large range, good descriptors and good modeling algorithms.
While we can’t help with the need of having a training data set of reasonable size and spread of activity, we can help with the rest.
The new Machine Learning (ML) methods in Forge, namely Support Vector Machines (SVM), Relevance Vector Machines (RVM) and Random Forests (RF) significantly expand the range of available QSAR model building options beyond the previous Field QSAR and k-Nearest Neighbors (kNN) regression options (Figure 1). Having access to a panel of well known, robust statistical tools gives you more opportunities to build a predictive model useful in project work.
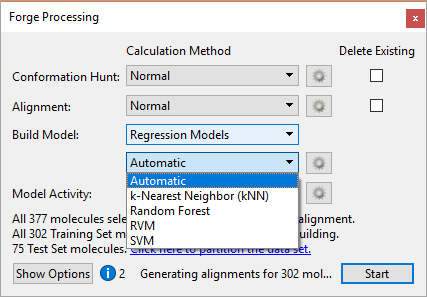
Figure 1. The new Machine Learning methods significantly expand the range of QSAR model building options in Forge V10.6.
Forge 3D electrostatic (based on Cresset’s XED force field) and volume descriptors are relevant for molecular recognition, and accordingly work very well for modeling activity and selectivity. These are used by Field QSAR and the new ML methods, while kNN can use either 3D electrostatic/shape or 2D fingerprint similarity.
For this experiment, I have re-used an aligned data set of Orexin 2 Receptor ligands from the US patent literature,1 which I previously presented in a case study on Activity Atlas™, a method in Forge for qualitatively summarizing the SAR for a series into a visual 3D model.
I split the 377 Orexin 2 ligands into two subsets: a training set of 302 compounds which I used to build the QSAR models, and a test set of 75 molecules which were used solely to assess their predictive ability.
Figure 2 shows the results obtained with Field QSAR and the ML methods in generating predictive models for OX2R pKi. Field QSAR, kNN and RF models were built using default conditions; for SVM and RVM, Forge suggested a fine tuning of the model building conditions as the training set is large.
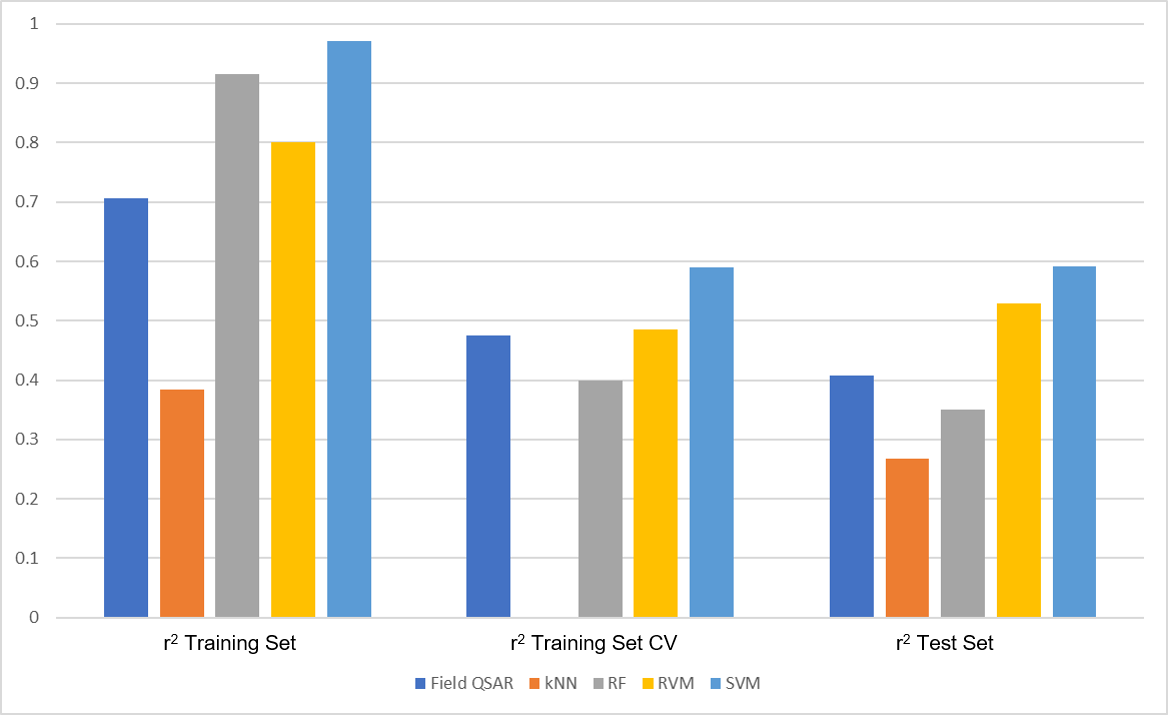
Figure 2. Performance of Field QSAR and ML methods on the Orexin 2 data set. Training set = 302 molecules used to build the models. Test set = 75 additional molecules used solely to assess the predictive activity of the models.
‘r2 Training Set’ is used to check the ability of each model to fit the data in the training set. It ranges from 1 (perfect fit) to 0 (no fit). From Figure 1, I can see that all models (except kNN in this case) give excellent results in fitting. However, this is hardly surprising as ML methods are well known for their ability to fit data of any type.
A more realistic check of the quality of the model comes from ‘r2 Training Set CV’. In cross-validation (CV), a part of the compounds in the training set is temporarily excluded from the model and the remaining compounds are used to build a model which is then used to predict the activity of the excluded compounds. Not surprisingly, ‘r2 Training Set CV’ is always lower than ‘r2 Training Set’, but the results for Field QSAR, RF, RVM and especially SVM are still good (kNN does not calculate this statistics).
Finally, ‘r2 Test Set’ gives an idea as realistic as possible of the performance of the model in real project work, as the model is asked to predict the activity of compounds it has never seen before. Most methods give reasonably good results, with SVM clearly outperforming the other methods with a more than respectable r2 test set = 0.59.
In a real project, I would not hesitate to choose SVM for filtering and prioritizing my list of ‘to-make’ compounds, with confidence that this is the best predictive power I can get for this specific data set.
What about kNN? It didn’t work very well on this data set; does it mean that it is not a good method? Not really. kNN is a robust, well known method particularly useful when working with multiple compound series, or with biological data which are derived from different sources. The fact that it didn’t work particularly well in this case does not exclude good performance in other projects.
This is the whole point of having several model building methods available: you can choose the one which gives best performance in your specific project.
If you think it must have been boring to calculate all these models separately, then I have good news: you don’t really have to. The default option in Forge is to automatically run all the ML models and pick the best one for you (Figure 3).
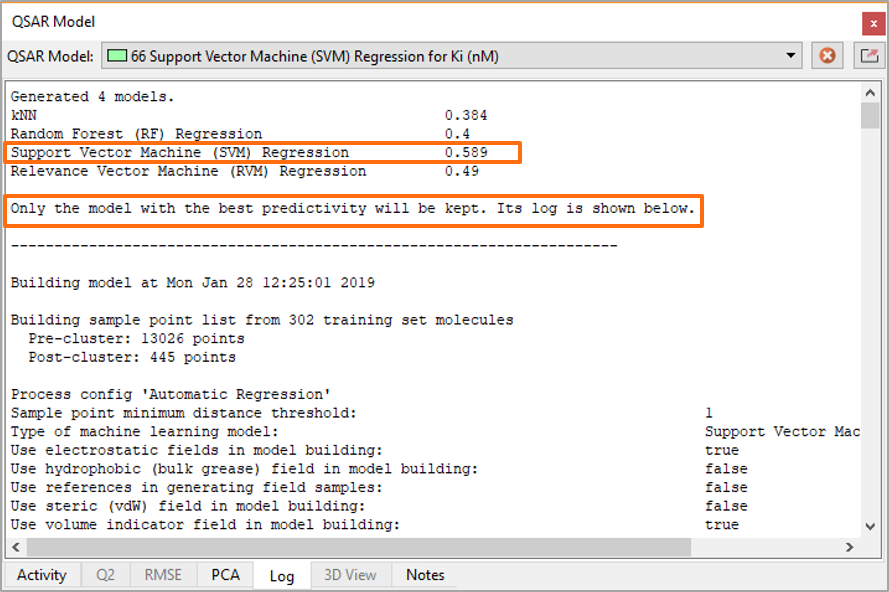
Figure 3. The Automatic model building option in Forge runs all the available ML methods and picks the best model for the output.
A significant part of a project chemist’s work is to design the next generation of active molecules. To achieve this, you need to understand what are the features which make some compounds active, and which are those that undermine the activity in others. In other words, you need to interpret the model.
Unfortunately, ML algorithms won’t help you here: they are complicated equations which cannot be easily translated back to 3D in terms of ligand-protein interactions.
Luckily, Forge provides you with two additional tools: Field QSAR 3D views and the Activity Cliffs Summary in Activity Atlas.
Field QSAR, when successful, gives you the best of both worlds, i.e., predictions and interpretation.
Activity Atlas is qualitative only (no predictions) and is great for understanding the SAR for your data using activity cliffs analysis, especially when the SAR landscape is jagged.
Activity Atlas in V10.6 includes a new Activity Cliffs Summary algorithm which generates more detailed SAR maps reducing the reliance on individual compounds, especially useful for small and medium sized data sets.
In Figure 4, you can see the Field QSAR maps compared to the new Activity Cliffs Summary maps for the Orexin 2 data set.
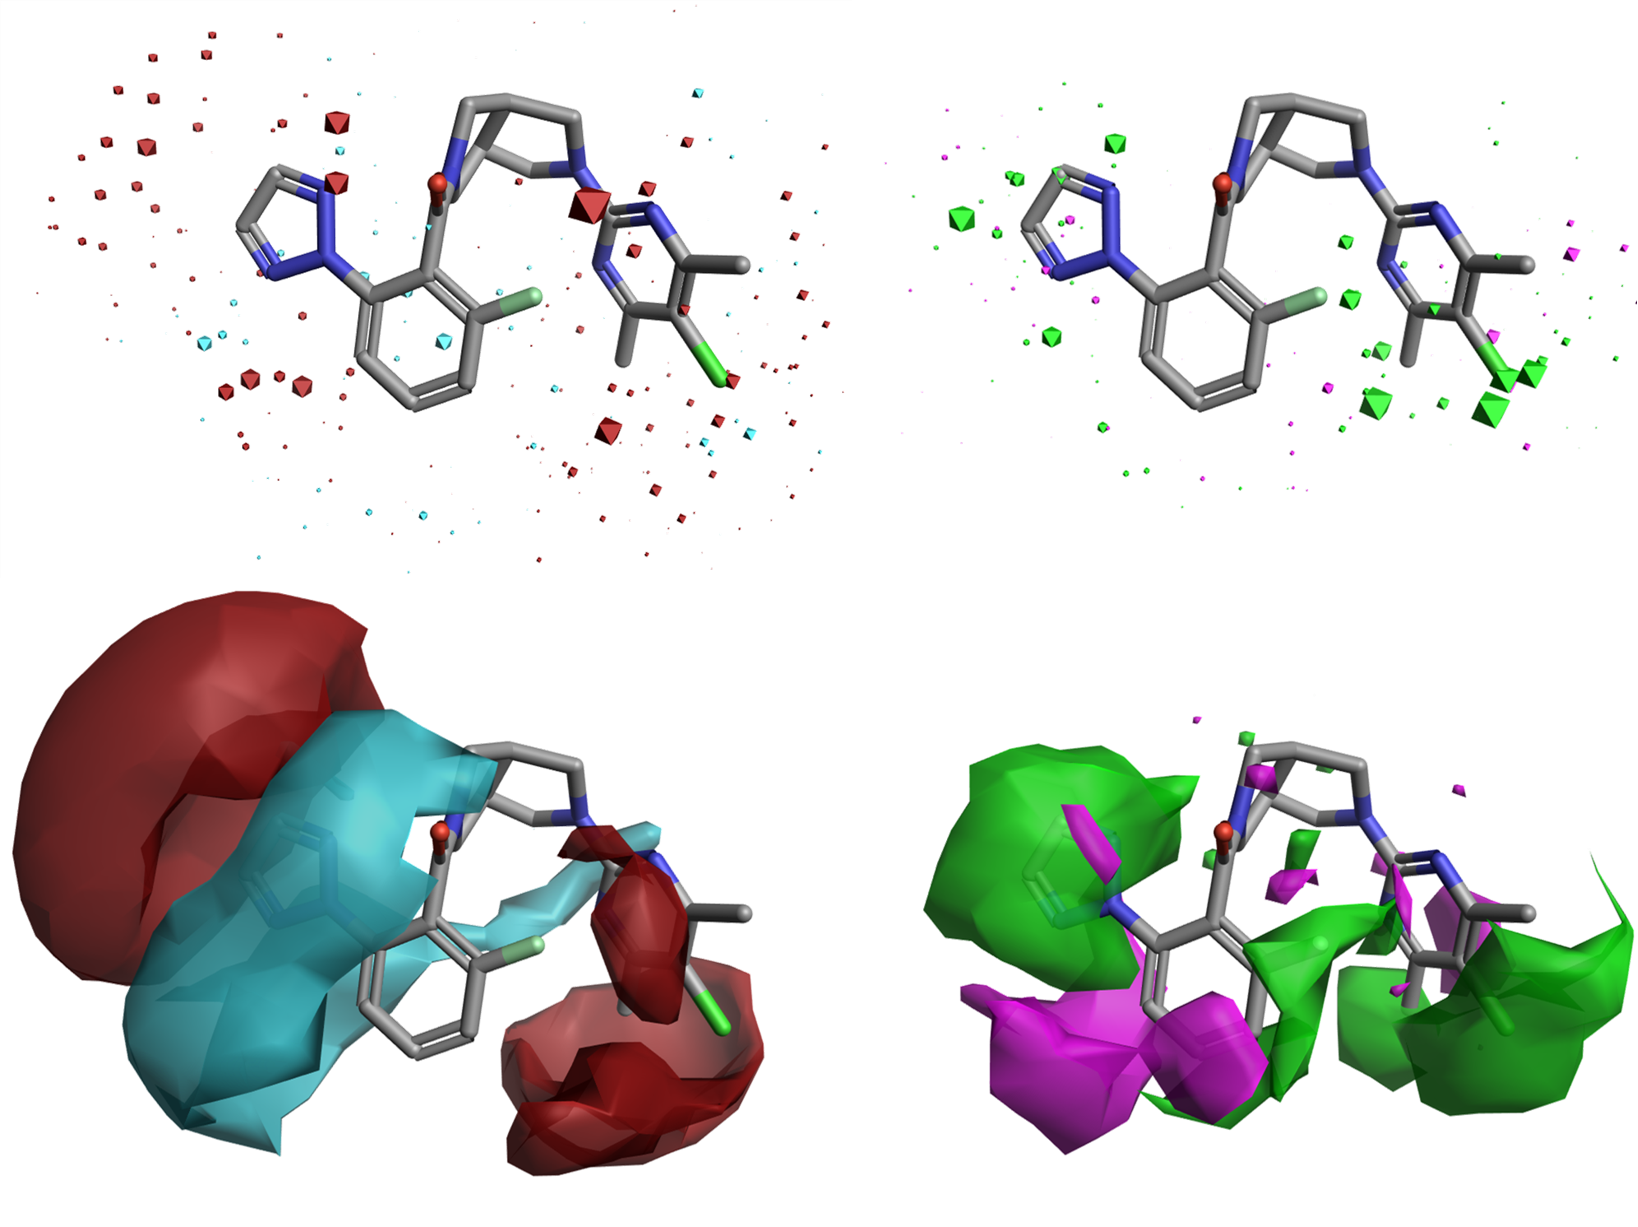
Figure 4. Top: Field QSAR electrostatic (left) and steric (right) coefficients. Bottom: Activity Cliffs Summary of Electrostatics (left) and Activity Cliffs Summary of Shape (right). Color coding: red = more positive electrostatic favors activity; blue = more negative electrostatic favors activity; green = favorable steric bulk; magenta = unfavorable steric clash.
Both types of maps clearly and consistently indicate where more positive (red) or negative (blue) electrostatics favors activity, and where steric bulk is favorable (green) or forbidden (magenta), providing invaluable indications for ligand design.
Sometimes the data you have are not as clean as you would like for the purposes of QSAR modeling. You may have % of inhibition data rather than pIC50s or pKis; data generated with different assays; or simply data which are qualitative in nature.
The new ML methods in Forge will work just as well to build classification models for sorting new molecules into existing categories (e.g., active/inactive). Forge will also provide appropriate visual tools (such as the confusion matrix, Figure 5) and classification performance metrics (Precision, Recall, Informedness) to assess the performance of the model and decide if it is good enough to be used in project work.
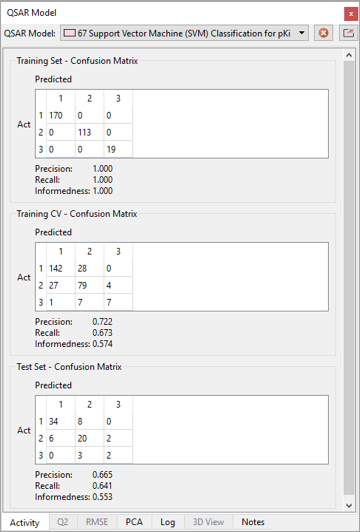
Figure 5. Confusion matrix for and useful statistics for an Orexin 2 classification model.
In Forge V10.6 you will experience strong performance, great pictures and new smooth transitions between storyboard scenes thanks to new graphic engine which generates enhanced 3D objects (Figure 6).
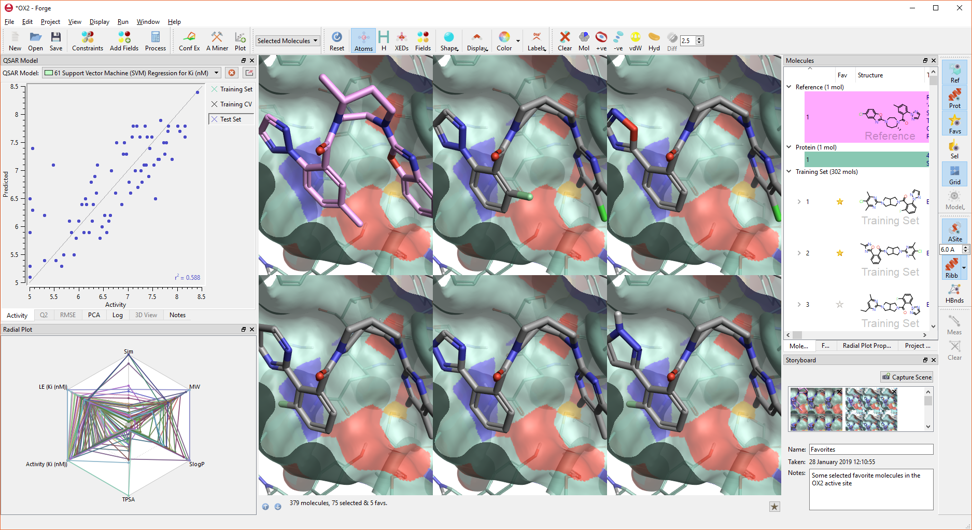
Figure 6. The new graphic engine in Forge V10.6 generates great pictures.
This release includes also many other GUI and usability improvements, including:
Figure 7. Compare different QSAR models with the new ‘pop-up’ button in the QSAR Model widget.
Sign up for our newsletter to receive product release announcements, request your free evaluation or contact us to learn more about how Forge can help advance your project.