Improving PROTAC properties via single-point changes to linkers
We explore how computational methods can be applied to proteolysis targeting chimera (PROTAC) design, to effectively tackle some of the ...
News
This sneak peek introduces a few of the new features that will be accessible in the upcoming release of Flare™, an accessible and flexible interface that enables medicinal chemists to design and prioritize new ligands for their drug discovery projects.
If a picture is worth a thousand words, making a movie is even better!
Movies are invaluable in all those cases where ‘showing’ is better, or quicker, than ‘telling’. For example, the short movie in Figure 1 shows how, in less than a minute, you can:
Figure 1. Short movie showing how to create a customized view of the active site of the PDB: 1OIT protein, displaying the main ligand-protein interactions in 2D and 3D.
Configuration of screen recording is flexible, giving you the option to choose the number of frames per second, the window resolution, and whether to record the whole Flare window, the main 3D Display only, or a full screen (Figure 2).
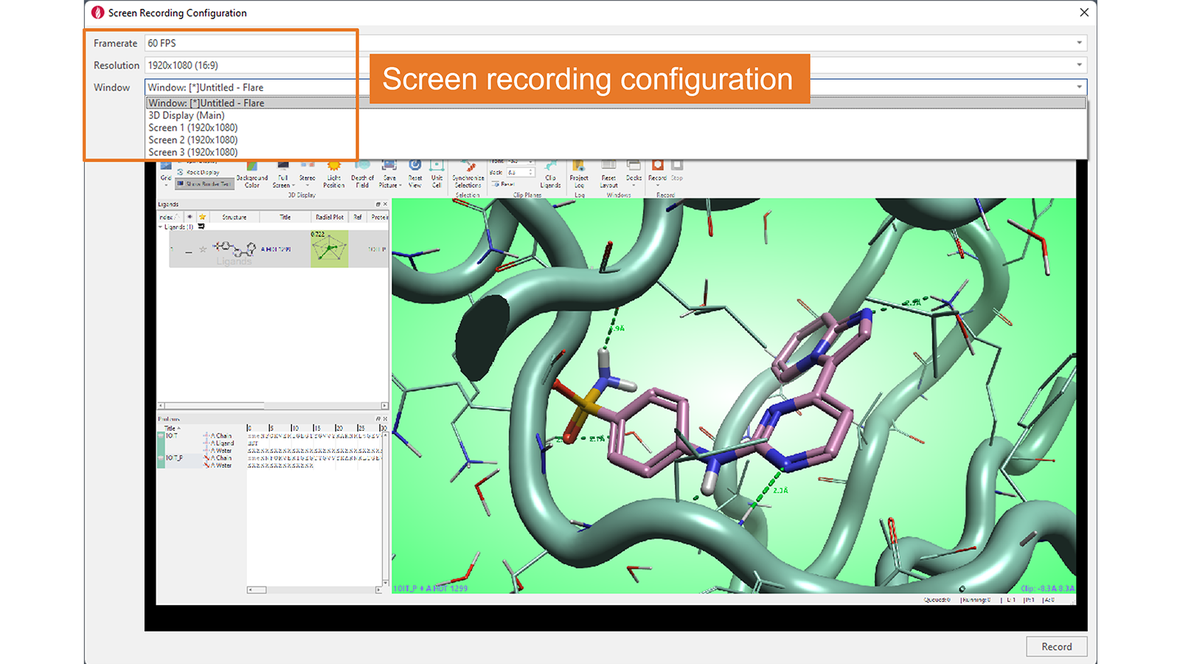
Figure 2. The Screen Recording Configuration menu gives great flexibility.
Flare V6.1 will introduce R-group Analysis (RGA), based on the RDKit decomposition method. This method can be used to rapidly analyze ligand series with a common core, exploring how changes in substituents affect activity and key physico-chemical properties, and identifying potential gaps in the chemical exploration strategy.
I have used this method to gain a quick understanding of the SAR of a dataset of 84 Tankyrase 2 (TNKS2) inhibitors taken from Waaler et. al. This series of ligands interacts with the TNKS2 active site by making a complex network of H-bond and aromatic-aromatic interactions with the biological target (Figure 3).
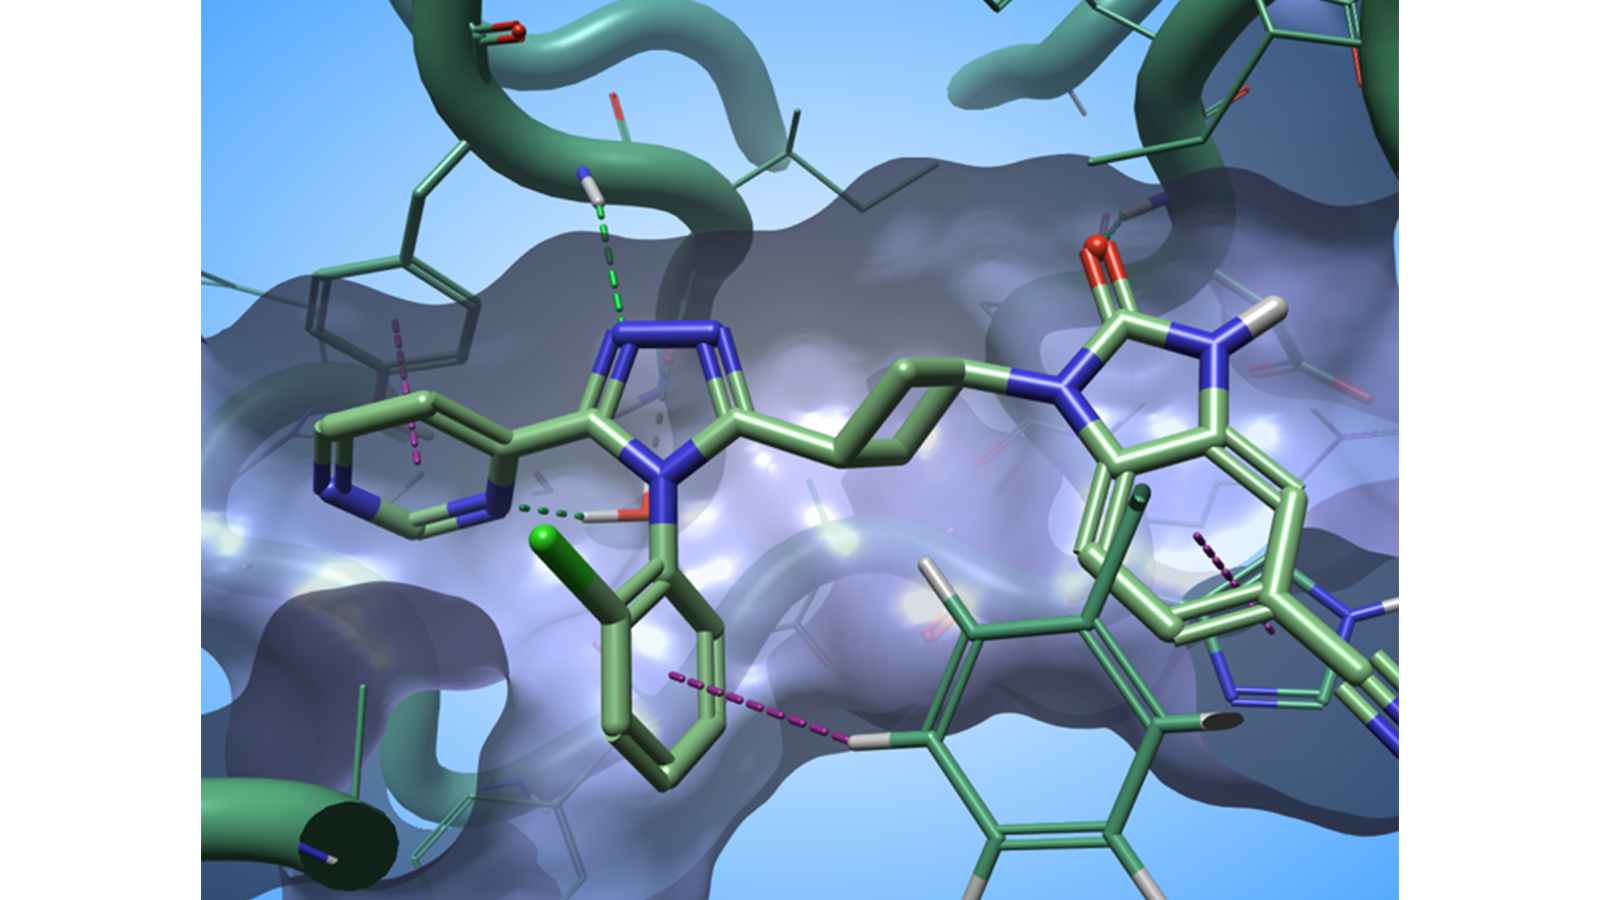
Figure 3. The ligand in PDB: 5NOB interact with the active site of TNKS2 through a complex network of H-bond and aromatic-aromatic interactions. Green dashed lines: H-bonds; purple dashed lines: aromatic-aromatic interactions.
RGA was performed using the ‘core’ structure shown in Figure 4 – left, to explore the effect of changing substituents in positions R1, R2 and R3 (Figure 4 – right) on TNKS2 activity.
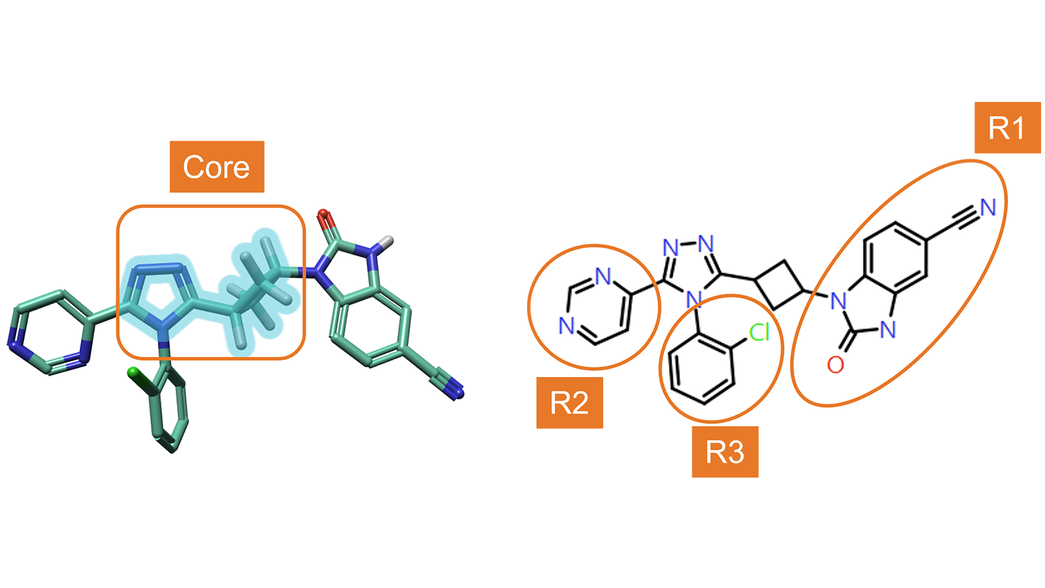
Figure 4. Left: Core structure used for RGA. Right: numbering of R-Groups found by RGA.
The results are shown in the ‘R-Group Analysis Results’ table in Figure 5, a tabular overview of the substituents found for each ligand at each attachment point, together with the associated properties.
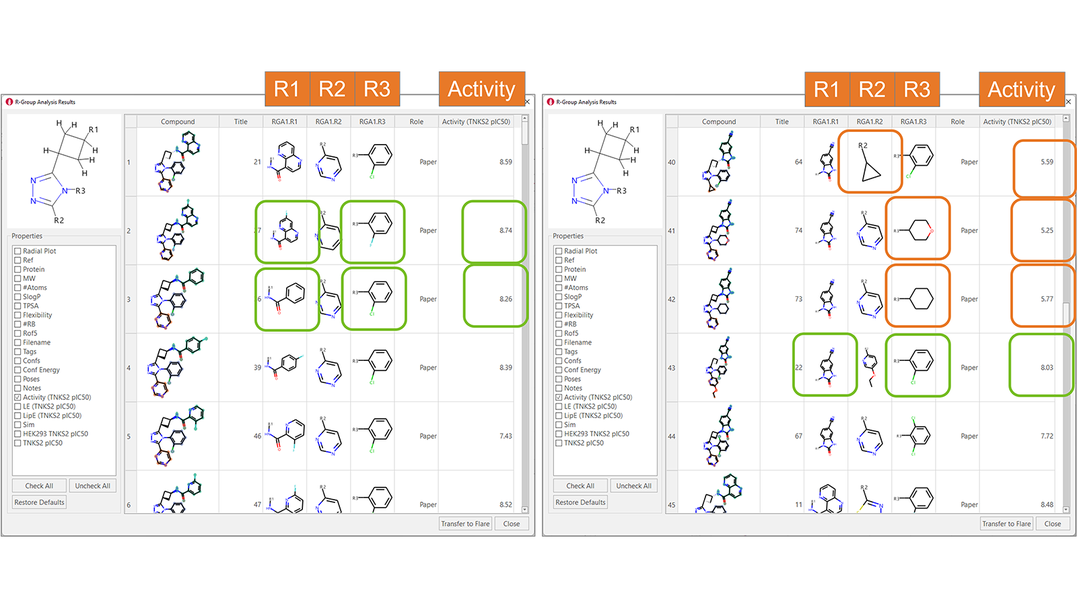
Figure 5. R-Group Analysis Results table. Green boxes: R-groups associated with higher biological activities. Orange boxes: aliphatic substituents are not tolerated in R2 and R3.
A quick inspection of the RGA table immediately gives useful insights about the SAR of this ligand series. For example, in the R1 position, amides carrying either monocyclic or bicyclic aromatic substituent are typically associated with good TNKS2 pIC50 (Figure 4 - left): benzimidazolones are also good (Figure 4 – right). 2-Cl-phenyl and 2-F-phenyl in R3 are both frequently associated with good TNKS2 pIC50. Finally, aliphatic substituents are unfavorable for biological activity in both the R2 and R3 positions.
Boxplots and heatmaps provide additional useful insights into the SAR of this ligand series.
Boxplots for R3 and R2 (Figure 6) confirm the need to have aromatic substituents in these positions to achieve high biological activity. For R2, an aromatic N in the ortho position is present in all the most active compounds. This empirical evidence is in in line with the crystallographic binding mode for these ligands (see Figure 3).
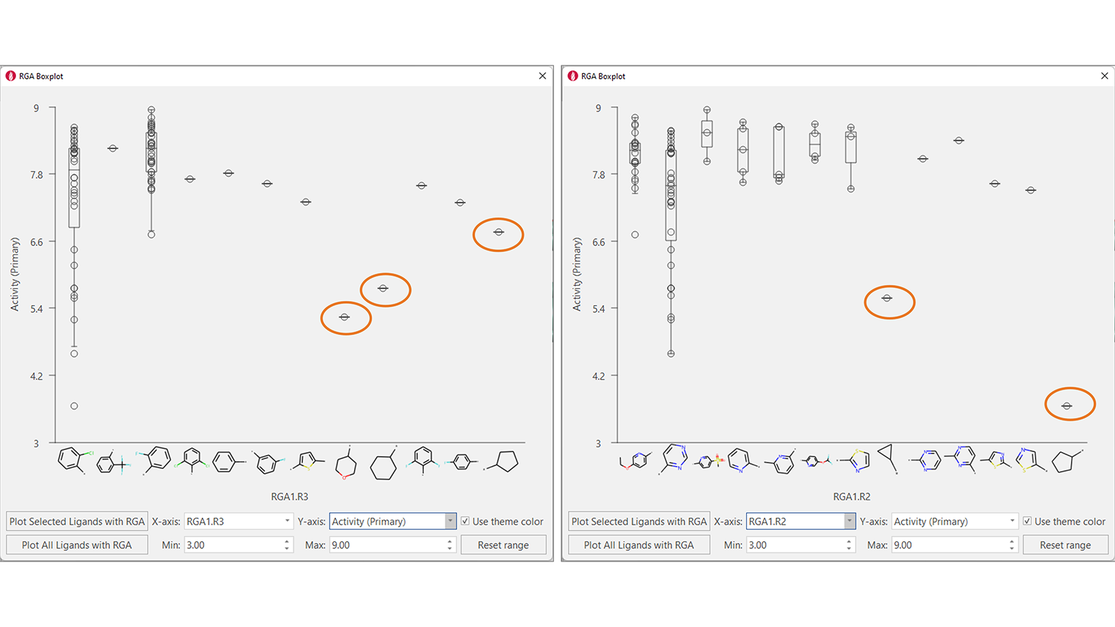
Figure 6. Boxplots for R3 (left) and R2 (right) confirm that aliphatic substituents are not well tolerated in these positions.
The boxplot for R1 shows that a larger variety of substituents has been successfully tried in this position: however, tertiary amides, small aliphatic amides and amides with the aromatic substituent not directly attached to the carbonyl group are not tolerated (Figure 7).
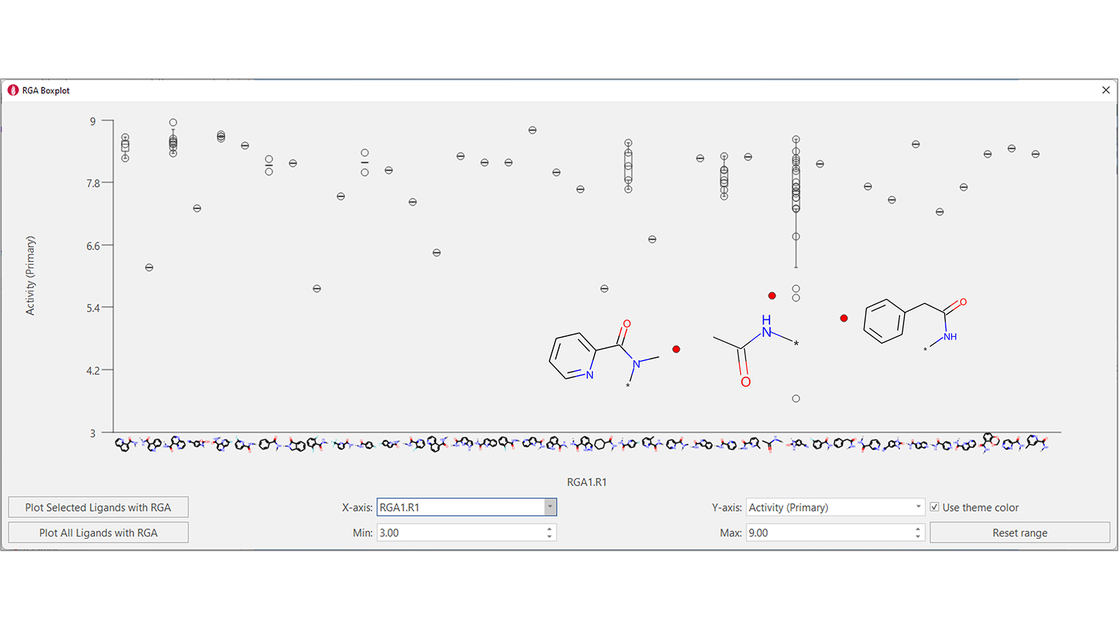
Figure 7. Boxplot for R1. A variety of aromatic amides has been tried for this position: however, some variations are not beneficial for activity.
Finally, heatmaps enable to analyze the impact on biological activity of changing two substituents at a time, also enabling the identification of potential gaps in the chemical exploration, i.e., combinations of favorable substituents which were not tried. For example, Figure 8 shows that the combination R2 = 2-Cl-phenyl/R3 = 5-Mesyl-2-pyridine was never tried, even though this R3 is associated with high-biological activity in combination with R2 = 2-F-phenyl.
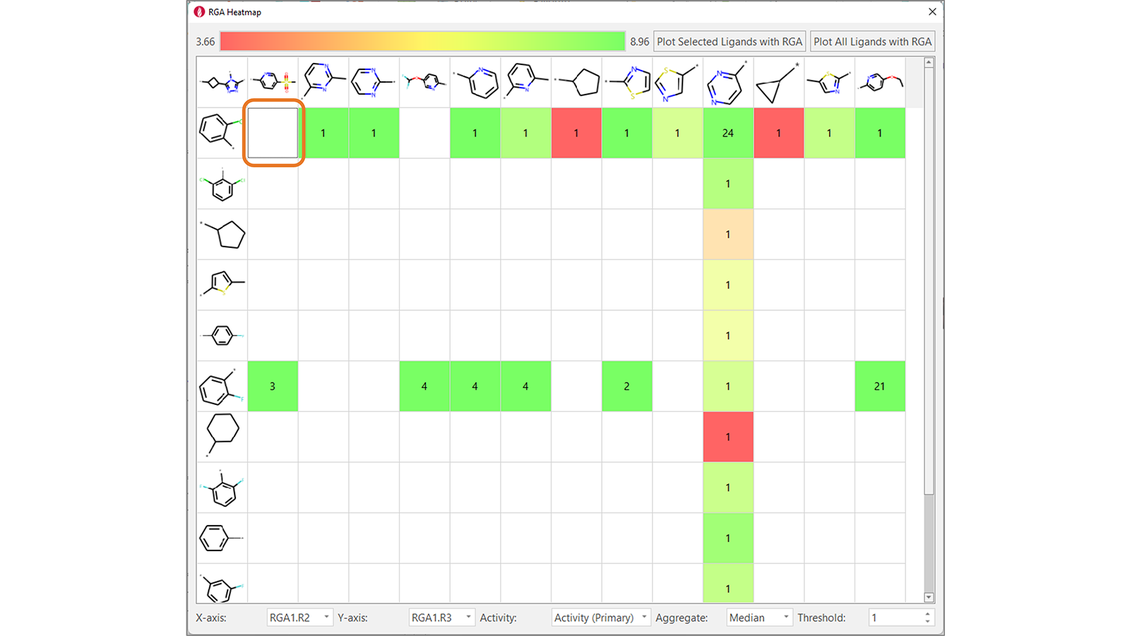
Figure 8. Heatmaps show the effect of changing two substituents at a time on ligand properties of interest (in this example, TNKS2 pIC50). They are also useful to find gaps in the chemical exploration: for example, the combination in the orange box was never tried for this ligand series.
Flare V6.1 will be released next month. Existing customers will receive details on how to upgrade nearer the release date, however, if you’re not currently gaining all the benefits of Flare for your discovery project you can: