Nathan Kidley†
† Cresset, New Cambridge House, Bassingbourn Road, Litlington, Cambridgeshire, SG8 0SS, UK
Abstract
Robust and predictive Quantitative Structure Activity Relationships (QSAR) models of activity can be built in Forge™,1 the Cresset ligand-based workbench for SAR and molecule design, using either Field QSAR (Cresset implementation of 3D-QSAR) or machine learning methods. These models can be created for any sufficiently large available dataset of compounds sharing a common binding mode and with a reasonable range of binding strength or activity. In this case study, a data set of 196 inhibitors of Janus Kinases JAK1 and JAK2 were used to develop predictive machine learning and Field QSAR models in Forge. Forge QSAR model information tools were used to select the model with optimal predictive ability, while the 3D display capabilities were used to visualize and interpret the model.
Introduction
Janus Kinases have been an active area of research with immune and malignant-related diseases. Tofacitinib is a JAK inhibitor on the market to treat rheumatoid arthritis, ankylosing spondylitis and ulcerative colitis. Tofacitinib2 has adverse side effects that limits the prescribed dose and identifying a compound without these adverse effects is of great interest. In this case study the source data is a Merck patent (US9394282)3 and scientific publication.4 The focus of their work was to design compounds with a higher maximum dose than Tofacitinib and hence more efficacious treatment for rheumatoid arthritis. Tofacitinib is a pan JAK inhibitor, with evidence that the JAK2 activity is the cause of observed anaemia in the clinic, thus the desire for increased selectivity of JAK1 over JAK2 and a good ADME profile.

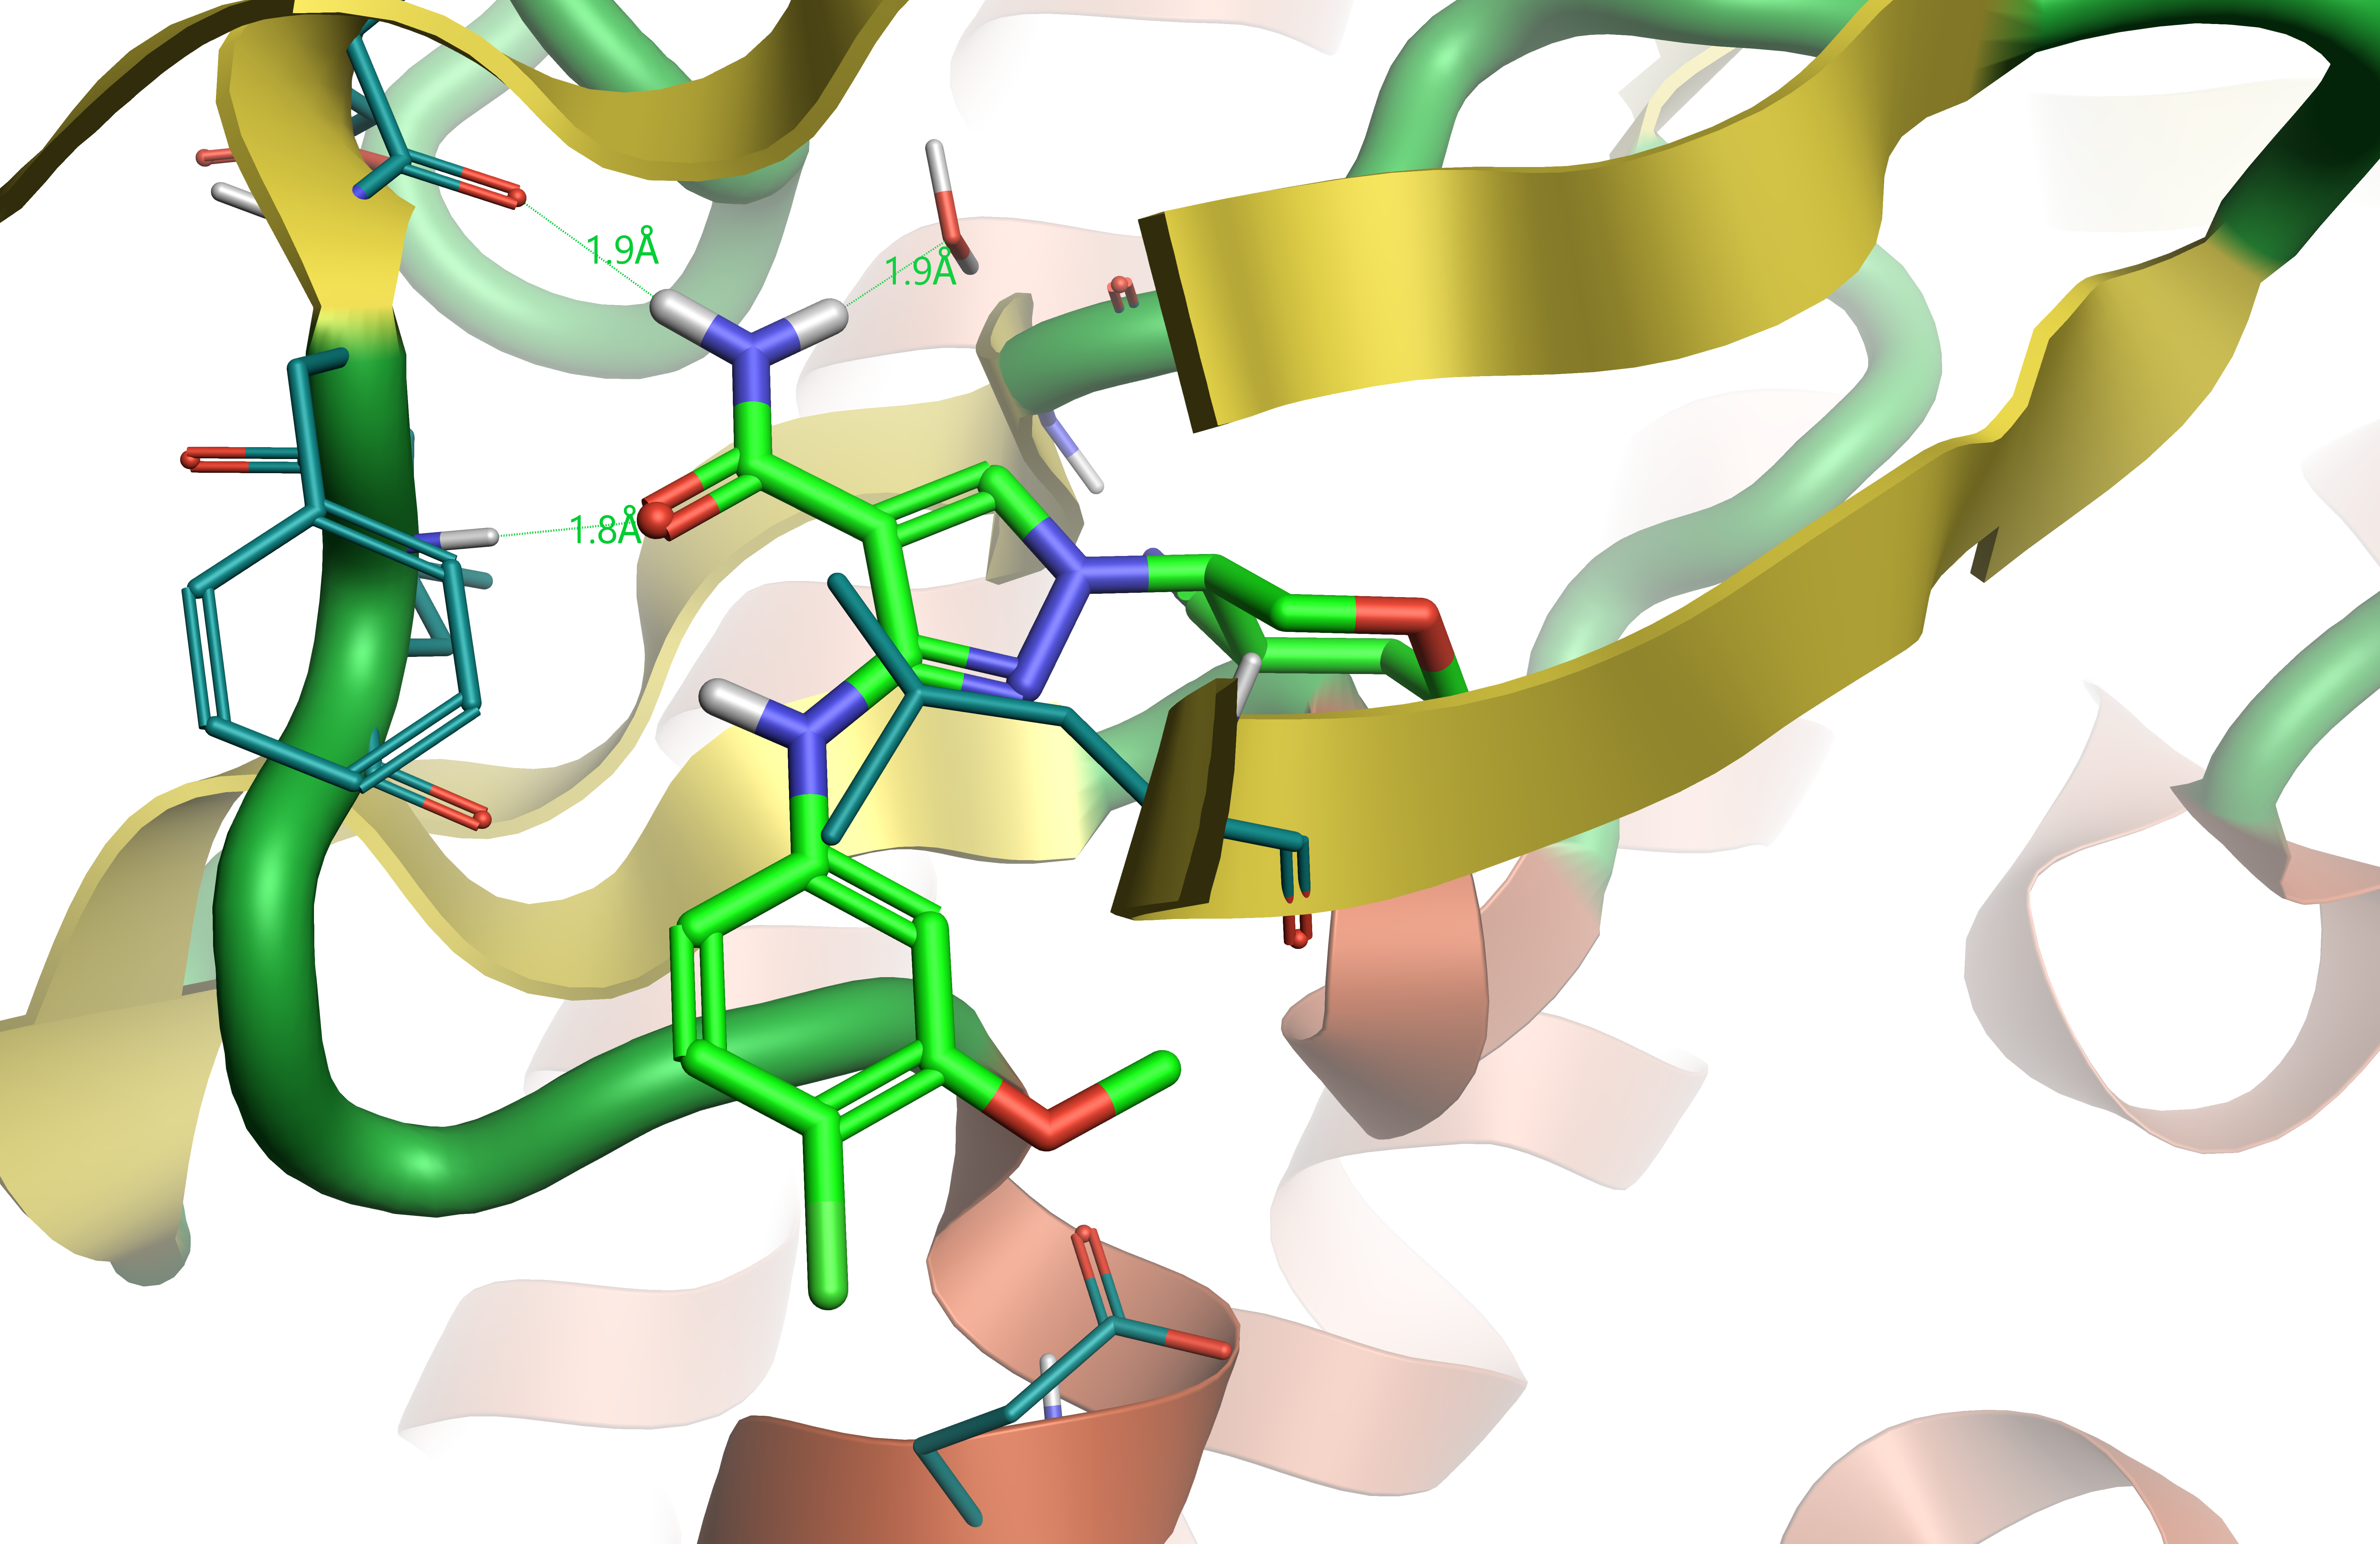
Figure 1. Crystallographic ligand compound 28 bound in JAK1 active site (PDB: 5WO4). Hydrogen bonds shown in dashed lines.
The Cresset field point description of molecules provides information about the regions of space surrounding a molecule, relevant to molecular recognition. The QSAR methods in Forge use probe positions that are determined directly from the field points of the aligned molecules to sample the electrostatic potential or volume for each molecule in the training set and generate descriptors for QSAR modeling.
Building QSAR models requires good quality data to build a model from. Working with 3D descriptors adds another level of difficulty requiring the generation of sensible conformations and meaningful alignments. Typically, good alignments for QSAR studies overlay the common substructure or common template very tightly, making it easier to identify changes in the ligands electrostatics and volume which explain the differences in activity.
Forge has many options to generate high-quality alignments, using either the field point overlay technique,5 or a Maximum Common Substructure (MCS) algorithm. Field and/or pharmacophore constraints can also be used in any alignment method to ensure interactions or substructures are correctly aligned. Manual intervention can occasionally be used to improve the alignment. However, care must be taken when doing this, to avoid the creation of a model where the active and inactive compounds artificially occupy different space.
Conformation hunt and alignment of compounds
Compound 28 (Table 1) is a close analogue of the compounds of interest. The protein crystal structure of JAK1 in complex with compound 284 (Figure 1) provides a bioactive conformation useful as a reference for ligand alignment.
Compounds US9394282, 6-3 and US9394282, 6-36 were aligned by Maximum Common Substructure to the X-ray conformation of 28 and used as additional references to improve the overall alignment of the compounds in the training set.
The conformation hunt parameters used were the standard ‘accurate but slow’, using a standard MCS alignment method and setting the hardness of the protein excluded volume to ‘Soft’.
Statistical analysis and results
The initial data set (196 compounds) was partitioned into 80% training set (157 compounds) and 20% test set (39 compounds). All 196 compounds have a measured JAK1 pIC50, only 172 compounds have a JAK2 pIC50 value.
The default option in Forge for QSAR model building will automatically apply all the available machine learning methods and select the model with the best test set prediction statistics. In addition, a Field QSAR model was also built and its prediction statistics compared to those of the machine learning methods. The results for all the methods are presented in Table 2, for JAK1 and JAK2 activities.
In this instance all the models in Table 2 perform very similarly, both with the training and test data sets. The random forest model is marginally the best overall, when looking at the statistical performance on the test set. While any of the models created by Forge here would be good to use to predict the activity of new compounds, Field QSAR offers the additional advantage over machine learning methods that the visual inspection of the model coefficients helps the interpretation of the model. This aids greatly in understanding what is driving activity in the model and interpreting it to aid in the design of new compounds.
Table 1. Absolute stereochemistry of compound 28 (crystal structure ligand), US93942, 6-3, and US9394282, 6-36.
| Compound 28 | US9394282, 6-3 | US9394282, 6-36 |
 |
 |
 |
Table 2. Comparison of the different QSAR model predicted vs measured statistics.
| Model | Data set | R2 for JAK1 activity | R2 for JAK2 activity |
| Field QSAR |
Training |
0.792 | 0.794 |
| Cross validation | 0.589 | 0.541 | |
| Test | 0.634 | 0.586 | |
| KNN | Training | 0.6 | 0.536 |
| Test | 0.626 | 0.503 | |
| Random Forest | Training | 0.906 | 0.902 |
| Cross validation | 0.524 | 0.521 | |
| Test | 0.655 | 0.622 | |
| Relevance Machine | Training | 0.778 | 0.745 |
| Cross validation | 0.556 | 0.545 | |
| Test | 0.589 | 0.623 | |
| Support Vector Machine | Training | 0.83 | 0.788 |
| Cross validation | 0.55 | 0.526 | |
| Test | 0.636 | 0.625 |
Model visualization and interpretation
Field QSAR in Forge is a regression method based on Partial Least Squares analysis, as such the linear relationship of the descriptors and activity can be used to provide a visual interpretation of the model. Large points in the ‘model coefficients’ plots indicate that the model has found a strong correlation between the electrostatic/steric field in that location and a compound that matches these features would have high activity.

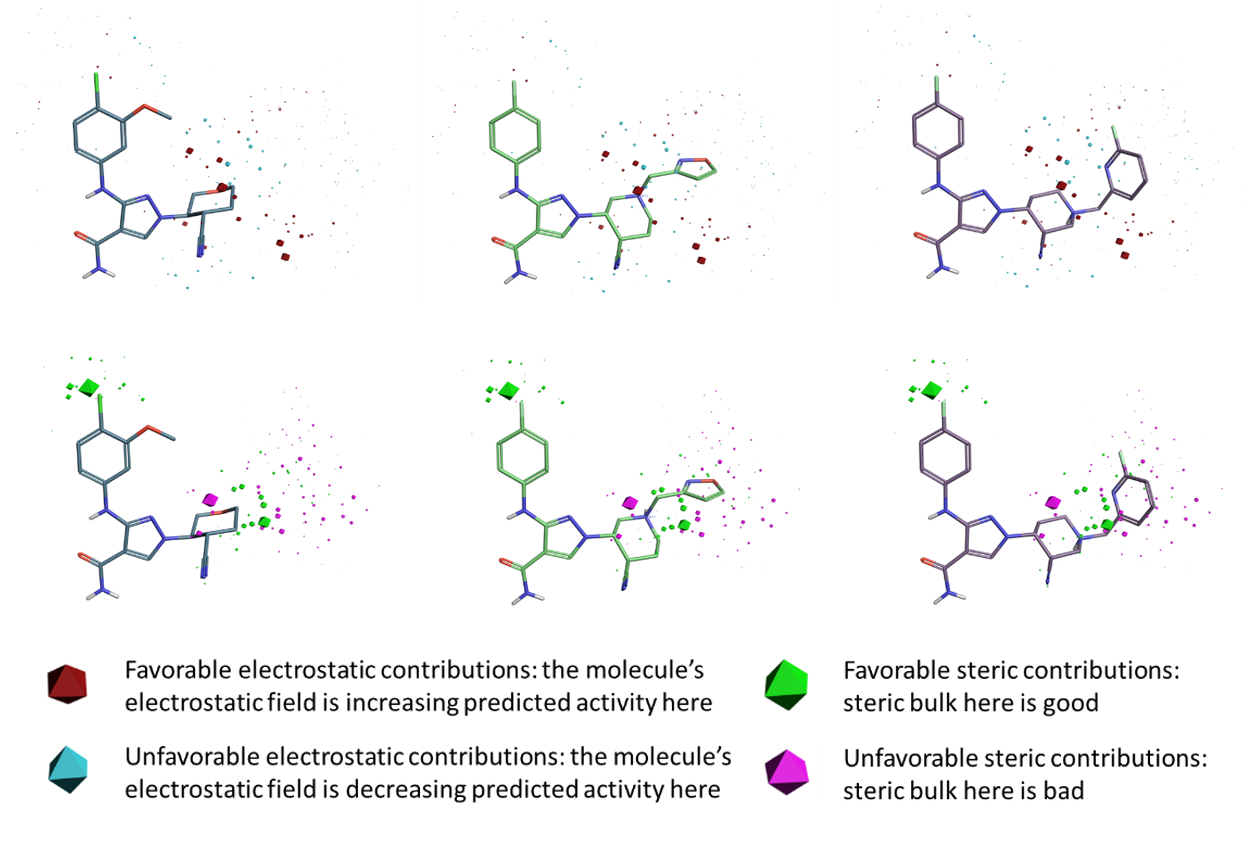
Figure 2. Model coefficient plot for the JAK1 Field QSAR model. Top row: electrostatic coefficients; bottom row: steric coefficients for Forge reference structures: X-ray pose of compound 28 (left) and aligned US9394282, 6-3 (middle), US939482, 6-36 (right) compounds respectively.

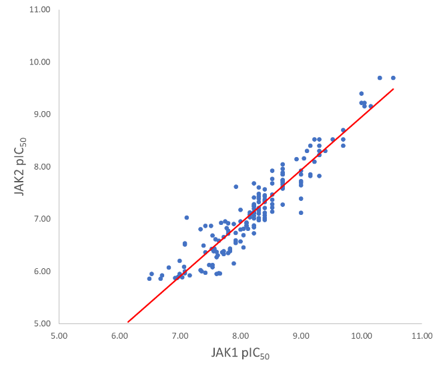
Figure 3. Plot showing the correlation between JAK1 and JAK2 pIC50 activity. The line of best fit has an r2 of 0.89; the slope is not 1 indicating a trend of more activity on JAK1 than JAK2.
The electrostatic and steric model coefficients for the five component JAK1 model are shown in Figure 2. Overall the Field QSAR model doesn’t have a particularly tight grouping of either electrostatic or steric coefficients in the region between the piperidine/tetrahydrofuran rings and the terminal isoxazole/pyridine rings of the reference compounds. This is likely to be due to the difficulty obtaining a very tight alignment due to the different ring conformations in the dataset.
The electrostatic ‘model coefficient’ polyhedra are present but much smaller than the steric polyhedra, the size indicating the importance of them to QSAR model. The most significant positive electrostatic coefficient is near the same meta position of the piperidine ring.
Whilst there is a diffuse grouping of polyhedra for the steric coefficients near the pyridine and isoxazole rings, it consistently reports that unfavourable steric coefficients in this area, informing that the large substituents in this region are not increasing activity of the compounds. A region of favorable steric coefficient (green polyhedra, observed in the bottom row of Figure 2) can be identified near the chlorine substituent on the phenyl ring. Another region of favorable steric coefficient is adjacent to the piperidine ring in the para position. while a region of unfavorable steric bulk (magenta polyhedra) is associated to the left meta position of the piperidine ring.
An almost identical pattern is observed for the JAK2 in-vitro data, which is not surprising seen the high correlation between the JAK1 and JAK2 activity data (R2 0.89, Figure 3). The assay results also show a general JAK1 selectivity bias, with all but two of the compounds in this dataset significantly more selective to JAK1 than JAK2. Siu et al4 suggest the single amino acid change E966 in JAK1 to D939 in JAK2 is responsible for the improved selectivity of some compounds in their work. In the dataset used in this case study there are few substituent variants on the phenyl ring, and the QSAR models do not find a strong SAR signal here. Activity Atlas was used to probe the explored chemical space, and it confirms the high value of the para-chloro substituent both from a steric and electrostatic perspective. Activity Atlas also highlighted that the meta and para positions have not been explored systematically from an electrostatic point of view in these compounds.
Conclusion
Forge was used to successfully build 3D-QSAR models for a set of 196 JAK1/2 kinase inhibitors, using a number of different QSAR methods. Activity Atlas and Field QSAR models facilitate visualization and interpretation of the models giving insights to where you have explored chemical space and what contributes to activity, and any limitations to the dataset. Using the insight and the predicted values is a powerful combination facilitating the design of new compounds and prioritizing them for synthesis and testing.
Care should always be taken when making a QSAR model, ensuring the data is sufficiently consistent, has a large enough range and distribution of activities. With any resultant model interrogated to ensure that the results are not an artefact of over parameterization, the model is not interpolating and can extrapolate in a robust manner. In addition to these challenges 3D-QSAR models have the additional complexity of conformational searching and ligand alignment.
Free evaluation of Forge
Flexible licensing options for Forge are available for computational chemists who can request a free evaluation to try it on drug discovery projects.
References and Links
- https://www.cresset-group.com/software/forge/
- Flanagan et al., J. Med. Chem. 2010, 53, 8468-8484
- Patent US9394282B2
- Sui et al., J. Med. Chem. 2017, 60, 9676-9690
- Cheeseright et al, J. Chem. Inf. Model., 2006, 46, 66