flare™
2D Interaction Maps
Summarize ligand-protein interactions in 2D
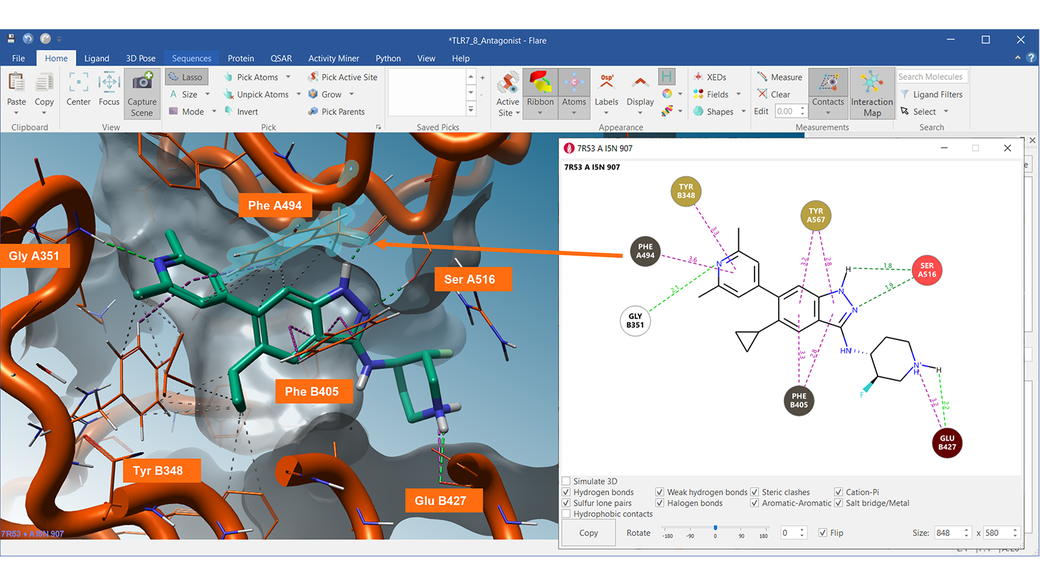
Use Interaction Maps in Flare to complement the visualization of ligand-protein contacts in the 3D window, creating a clear map of favorable ligand-protein interactions and steric clashes in 2D.
Complex 3D network of contacts can be summarized in a clear and interactive 2D diagram. In the Interaction Map, each residue, water molecule or cofactor interacting with the ligand is represented by a colored circle reporting the residue’s 3-letters code and chain number (for example, PHE A494 or GLU B427).
The 2D diagram is interactive and enables you to choose the type of contact you want to show (for example, hide or show hydrophobic contacts), while clicking on a residue in the map selects it also in the 3D window.

The 2D Interaction map shown on the right-side nicely summarizes the complex network of ligand protein-interactions made by Compound 15 with the TRL8 target (PDB 7R53).