flare™
R-group analysis
Understand influence on key compound properties of the R-group variations made on your ligand series
R-group Analysis (RGA) in Flare is based on the RDKit Decomposition method. RGA can be used to rapidly analyze the substitution pattern of a chemical series to identify all R-group variations around a common core. This enables you to assess their influence on key compound properties, and to identify gaps in your chemical exploration.
- Easily select the desired core to explore from the 3D window
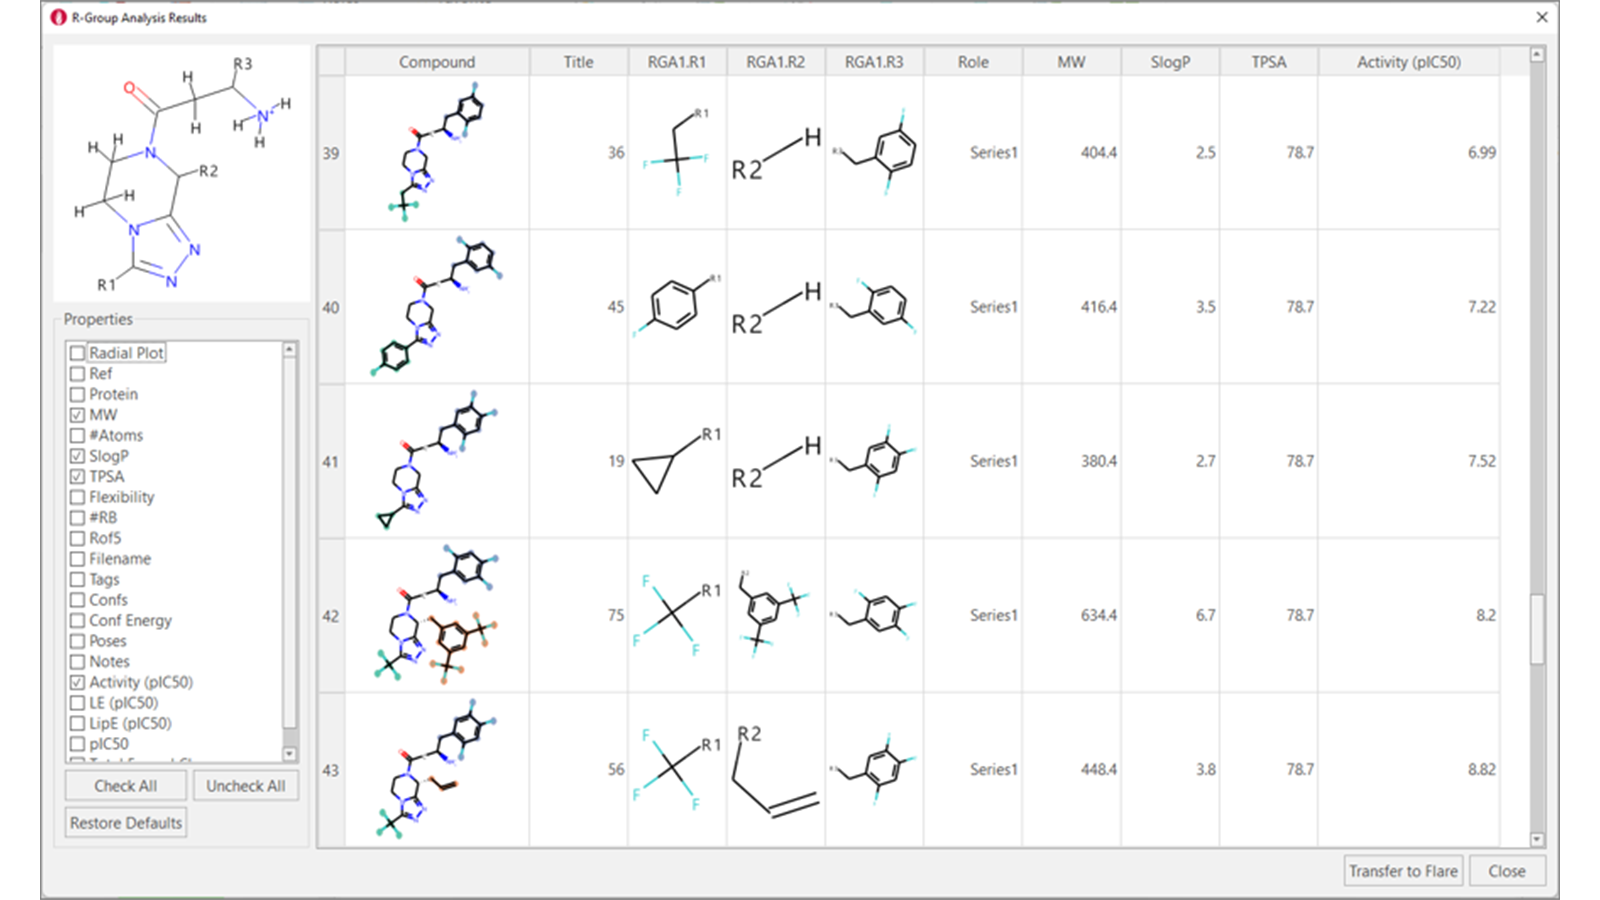
- View the results as a table reporting the R-group variations for each compound together with key properties
- Choose the properties to show in the RGA table
- Transfer the results back to Flare for further analysis

The R-Group Analysis Results table
RGA Boxplots
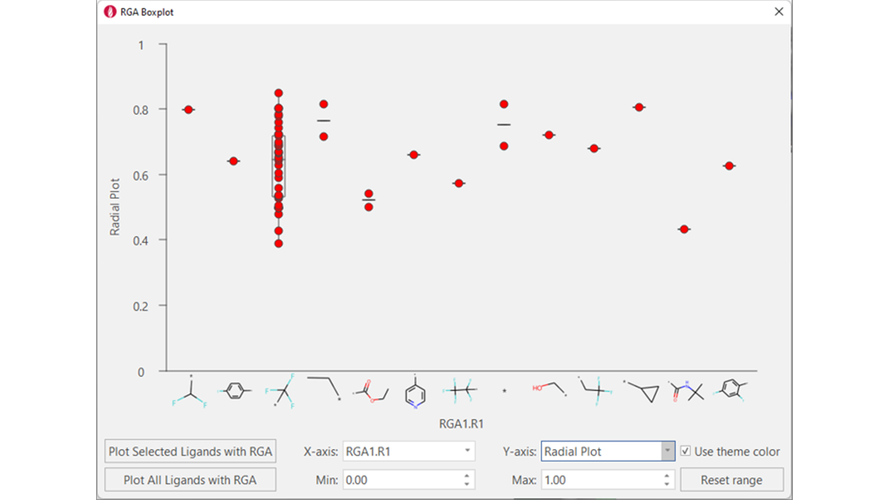
Use RGA Boxplots to investigate the influence on key compound properties such as biological activity or lipophilicity of changing the R-groups at a certain attachment point.

RGA Boxplots can be used to analyze the distribution of properties for each R-Group found at the selected attachment point
RGA Heatmaps
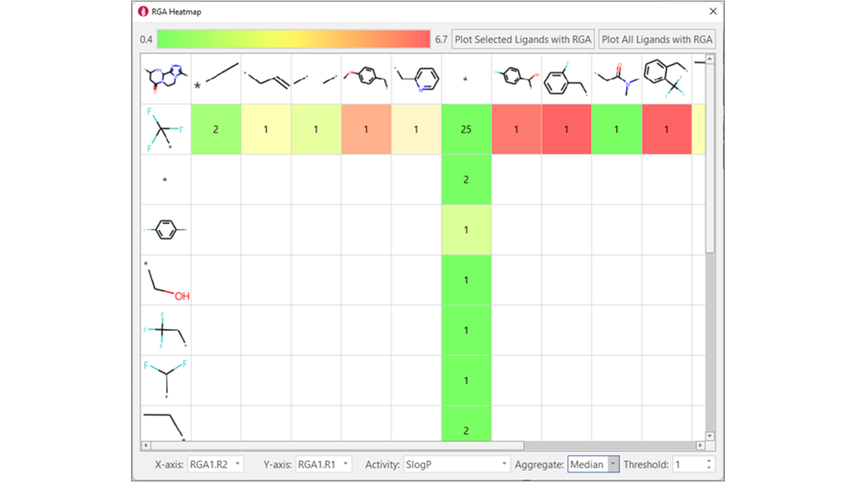
A highly effective visual tool to analyze the effect of changing substituents at two different R-group positions on key compound properties.
RGA Heatmaps are also useful to quickly identify gaps in the chemical exploration for your compound series, by finding the combinations of most promising substituents you haven’t tried yet.

RGA Heatmaps enable you to find the gaps in your chemical exploration strategy