Improving PROTAC properties via single-point changes to linkers
We explore how computational methods can be applied to proteolysis targeting chimera (PROTAC) design, to effectively tackle some of the ...
News
We present an exercise in in silico medicinal chemistry: using Activity Atlas1 to assess and understand the features that drive activity for a collection of CDK2 inhibitors; using Spark2 to suggest new ideas to explore; then visually assessing those new ideas in Forge3 in the context of the qualitative 3D-SAR models generated by Activity Atlas.
The efforts of medicinal chemists in their quest to design new, active ligands can be summarized by answering three deceptively simple questions:
These questions are frequently addressed separately. However, there is much value in considering the questions simultaneously with the help of Forge and Spark.
In this case study, Cresset ligand-based design tools are used to address the questions above with respect to the well-studied target for oncology Cyclin-dependent kinase 2 (CDK2).
A collection of 38 imidazopyridine containing CDK2 inhibitors was gathered from CHEMBL4 and curated to create a molecular dataset spanning a pIC50 range of 4-9.
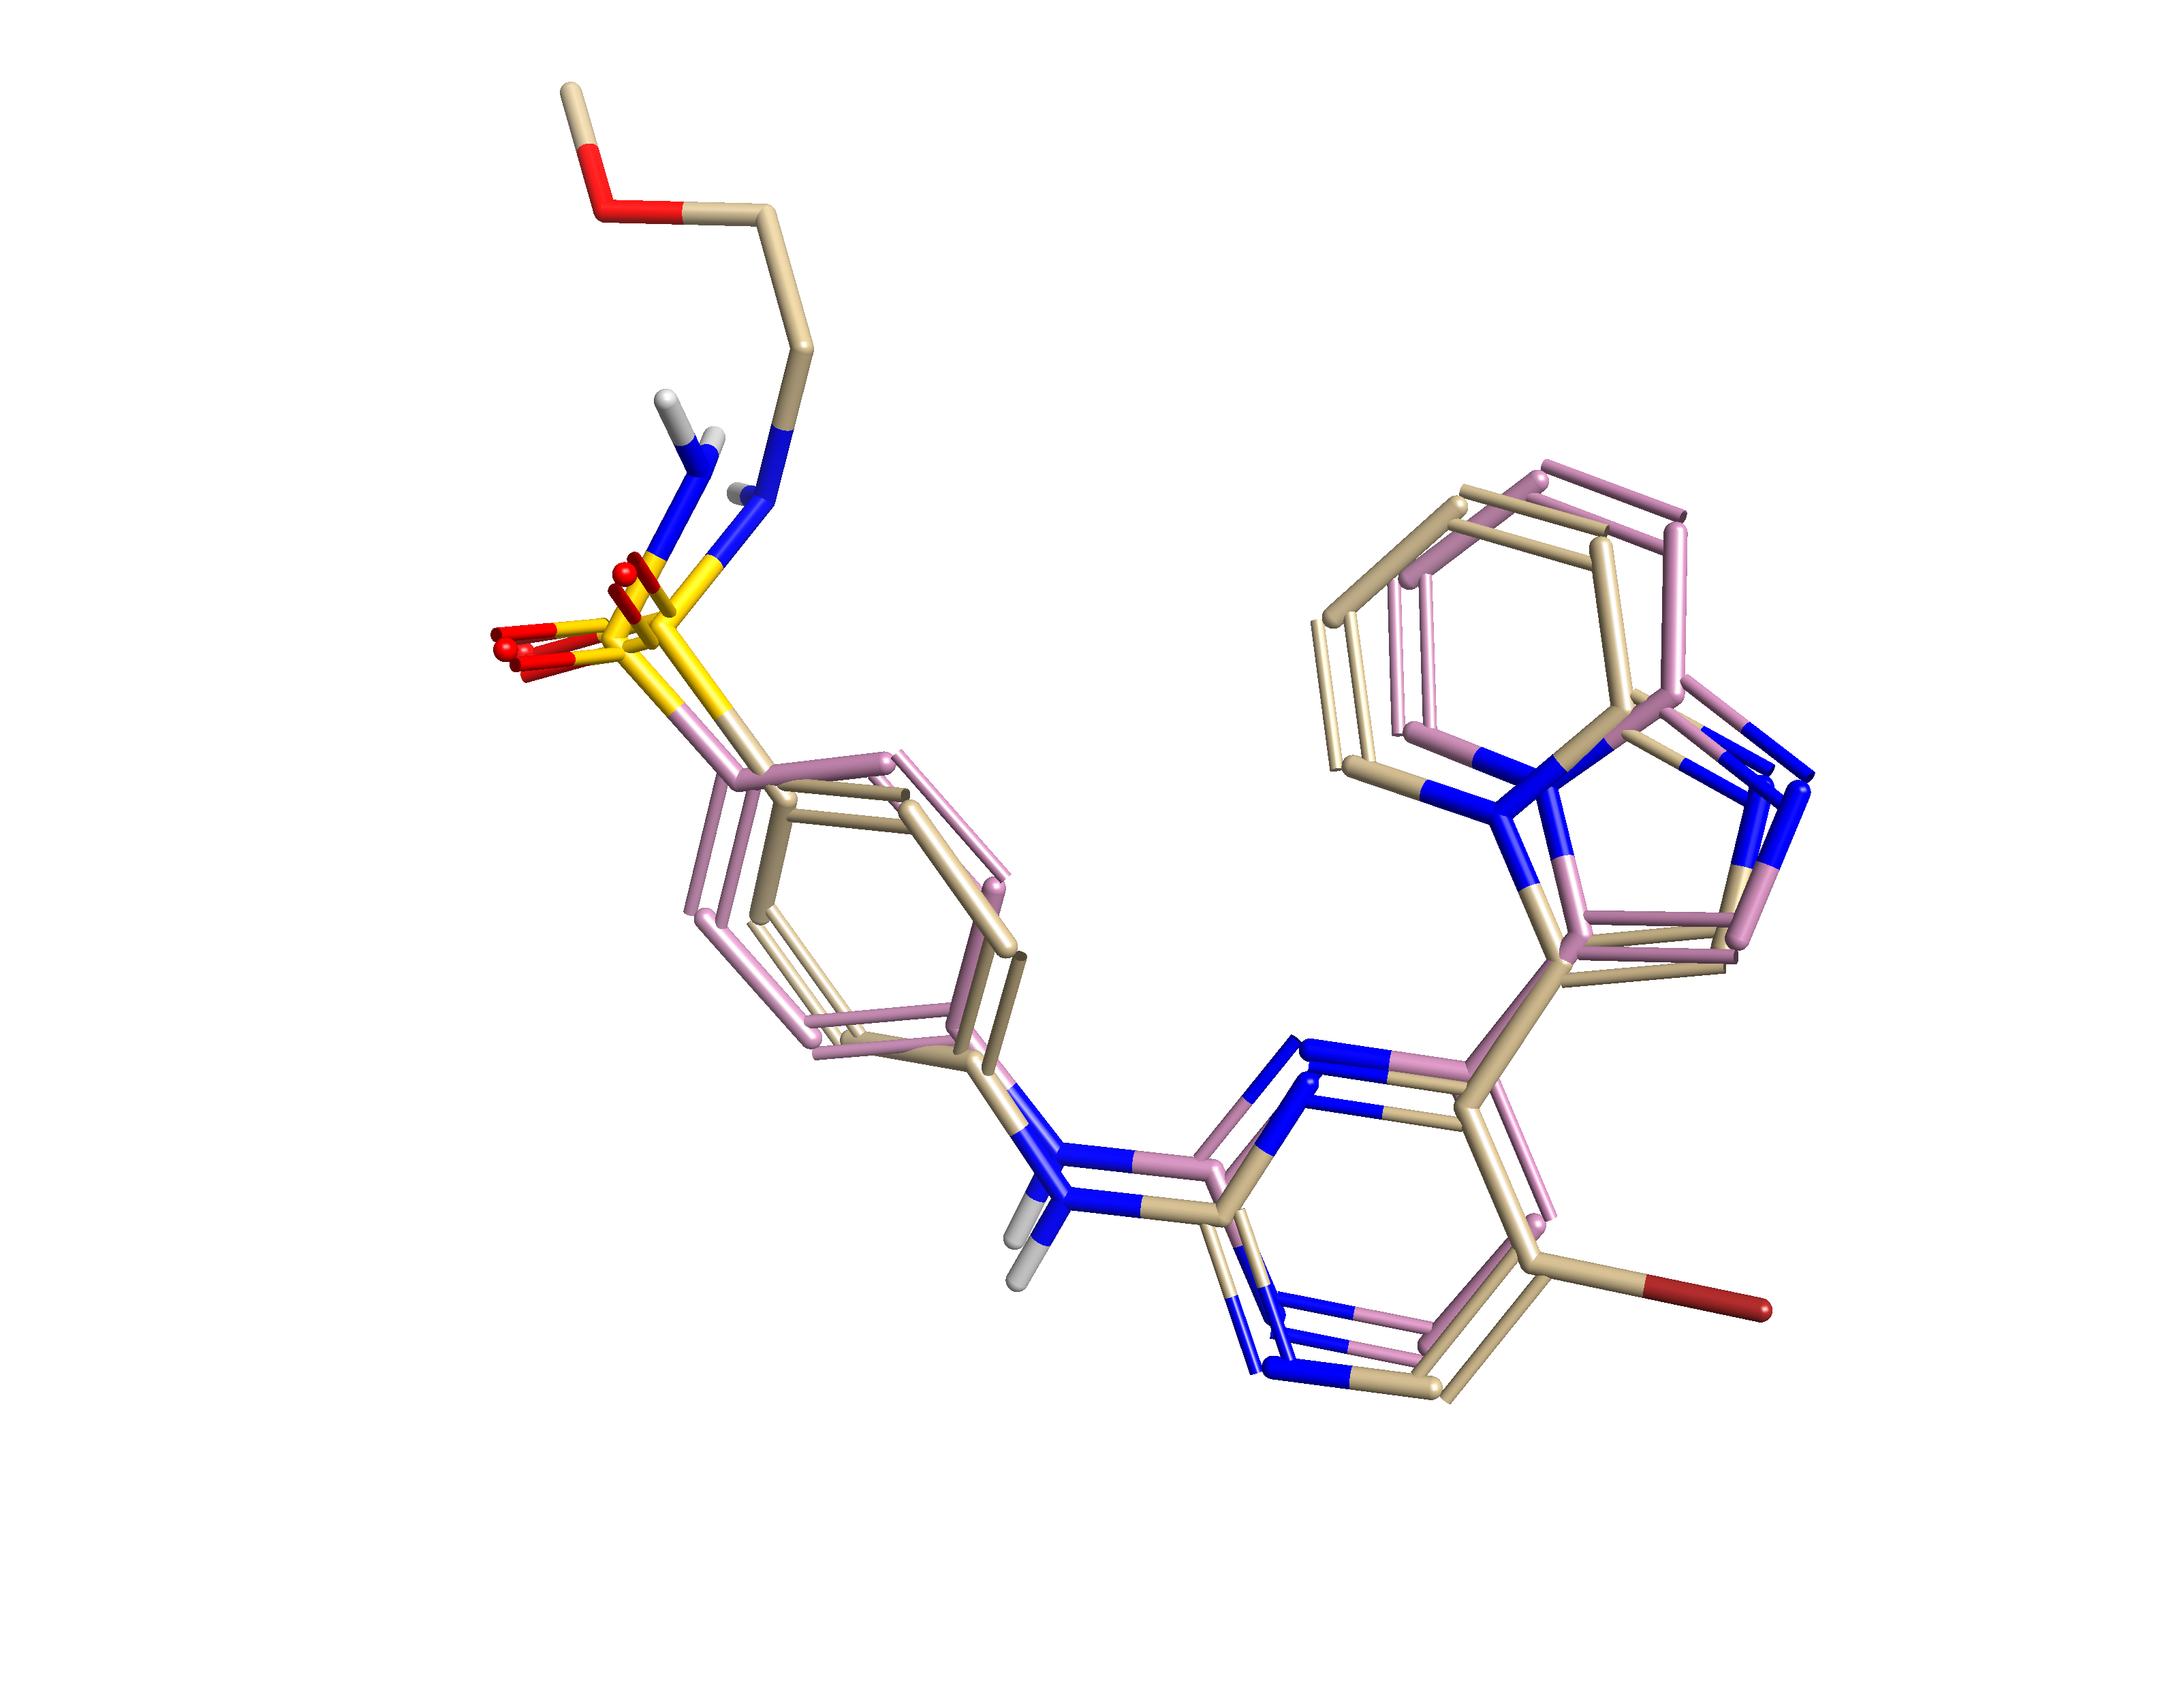
Prior to assessing any relationship between activity and 3D structure, it is necessary to align the collection of molecules. In this case we chose to align the molecules to the ligand derived from the crystal structure 1OIT (CHEMBL73303: pIC50 =9.0). As many of the compounds in the dataset contained a solvent-exposed group that was not present in this reference an additional active ligand was identified (CHEMBL70808: pIC50 = 8.52) that maintained the core, but expanded beyond the terminal sulfonamide of the 1OIT ligand. The CHEMBL70808 ligand was aligned to the 1OIT ligand using manual and automated methods to ensure good correspondence of the imidazo[1,2-a]pyridine groups that are deeply embedded in the binding site. Further manual alignment was employed to ensure comparable orientation of the sulfonamide, despite being solvent-exposed. The pair of ligands (Figure 1) was then used as a combined, equally weighted, reference for the subsequent alignment of the 38 compounds gathered.
A collection of 38 imidazopyridine containing CDK2 inhibitors was gathered from CHEMBL4 and curated to create a molecular dataset spanning a pIC50 range of 4-9.
Prior to assessing any relationship between activity and 3D structure, it is necessary to align the collection of molecules. In this case we chose to align the molecules to the ligand derived from the crystal structure 1OIT (CHEMBL73303: pIC50 =9.0). As many of the compounds in the dataset contained a solvent-exposed group that was not present in this reference from an additional active ligand was identified (CHEMBL70808: pIC50 = 8.52) that maintained the core, but expanded beyond the terminal sulfonamide of the 1OIT ligand. The CHEMBL70808 ligand was aligned to the 1OIT ligand and subjected to additional manual alignment in order to better align the imidazo[1,2-
a]pyridine groups that are deeply embedded in the binding site. Further manual alignment was employed to ensure comparable orientation of the sulfonamide, despite being solvent-exposed. The pair of ligands (Figure 1) was then used as a combined, equally weighted, reference for the subsequent alignment of the 38 compounds gathered.
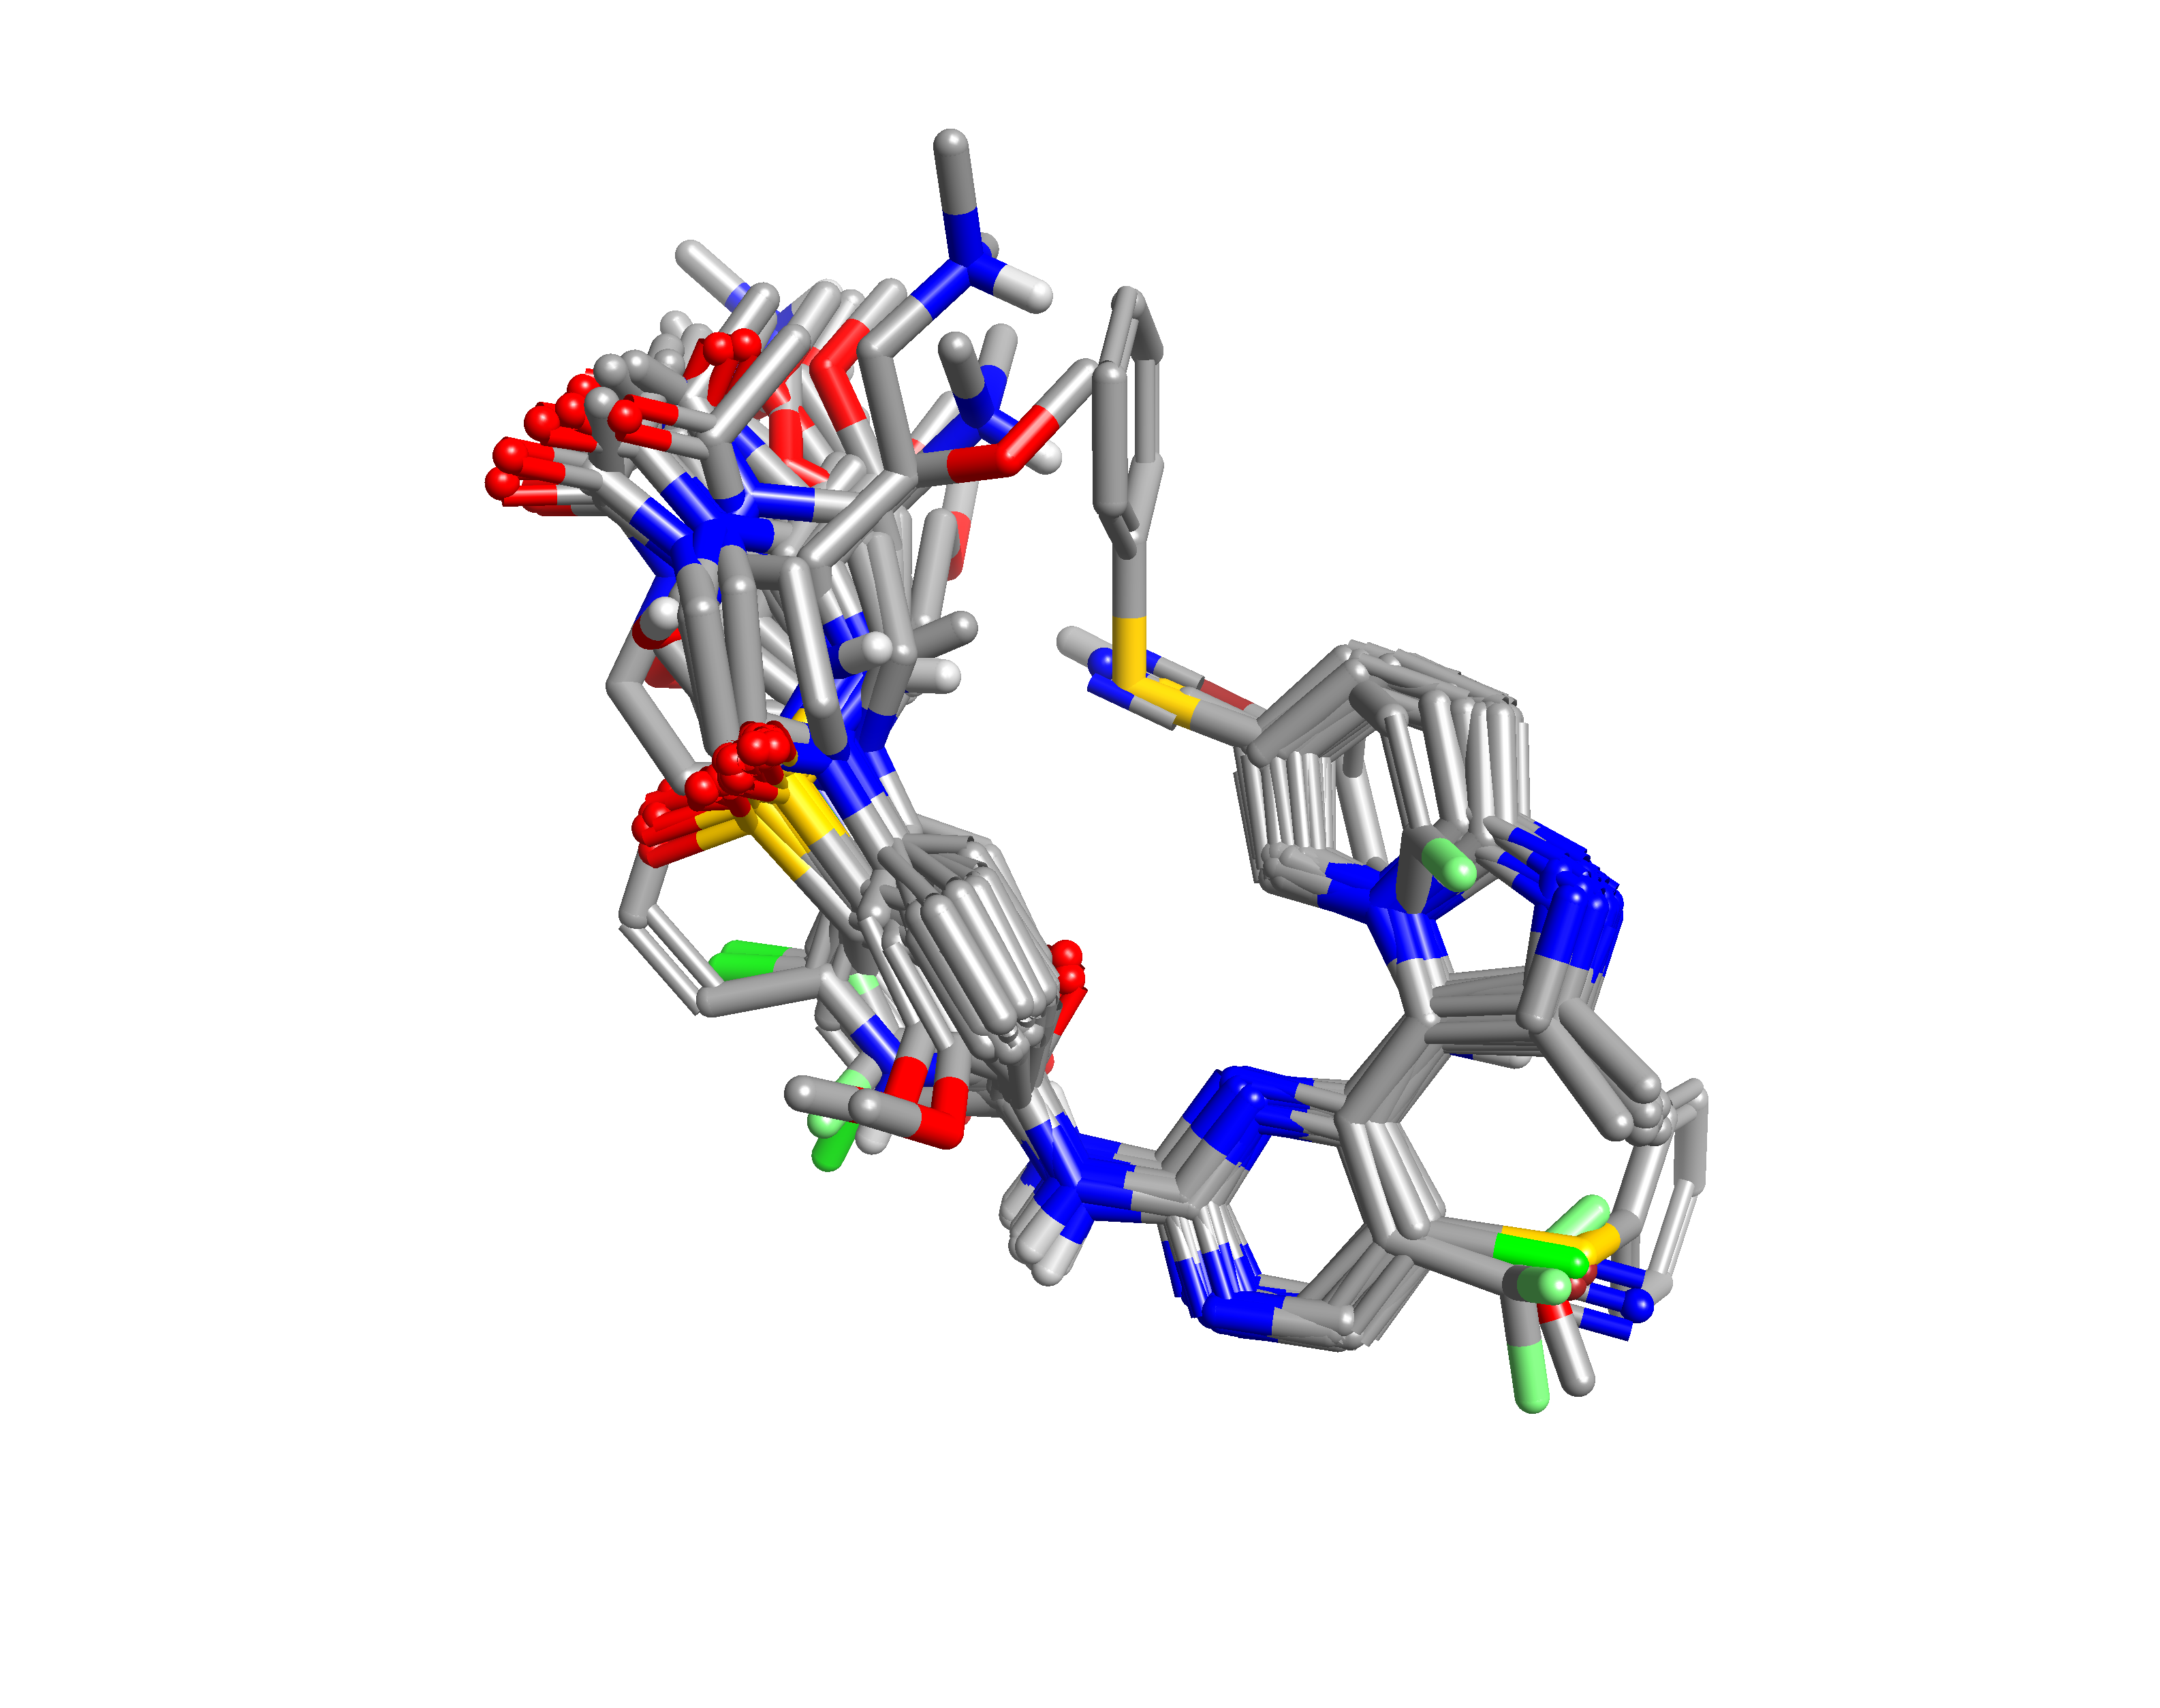
Within Forge, the collection of CDK2 inhibitors was aligned to the two equally weighted references, using 50% fields and 50% shape and a soft protein excluded volume to generate an alignment (Figure 2) and similarity score (range 0.59 through 0.85). As alignment is at the heart of every 3D-QSAR approach, the alignments were visually inspected and manually tweaked to ensure consistent orientation of all side chains.
To generate a qualitative assessment of the features driving activity, an Activity Atlas model calculation was performed.
Activity Atlas is available in Forge, and generates visually striking maps based on the aligned molecules. The models depict: the average electrostatics and shape for active compounds; the summary of activity cliffs in electrostatics, shape and hydrophobicity; and the regions explored. The models generated by Activity Atlas are intended to help answer the questions asked earlier and are shown in Figures 3-5.
In Figure 3, the average active molecule map is depicted. It indicates the common electrostatics and hydrophobic features of active molecules in the dataset – essentially molecules that do not have these features are unlikely to have any significant activity. The central H-bond donor (amine)/H-bond acceptor (pyrimidine) motif mapping the interaction with the hinge region of CDK2 is present in all actives. Negative regions near the H-bond acceptors of sulfonamide and imidazopyridine are also present on all actives.
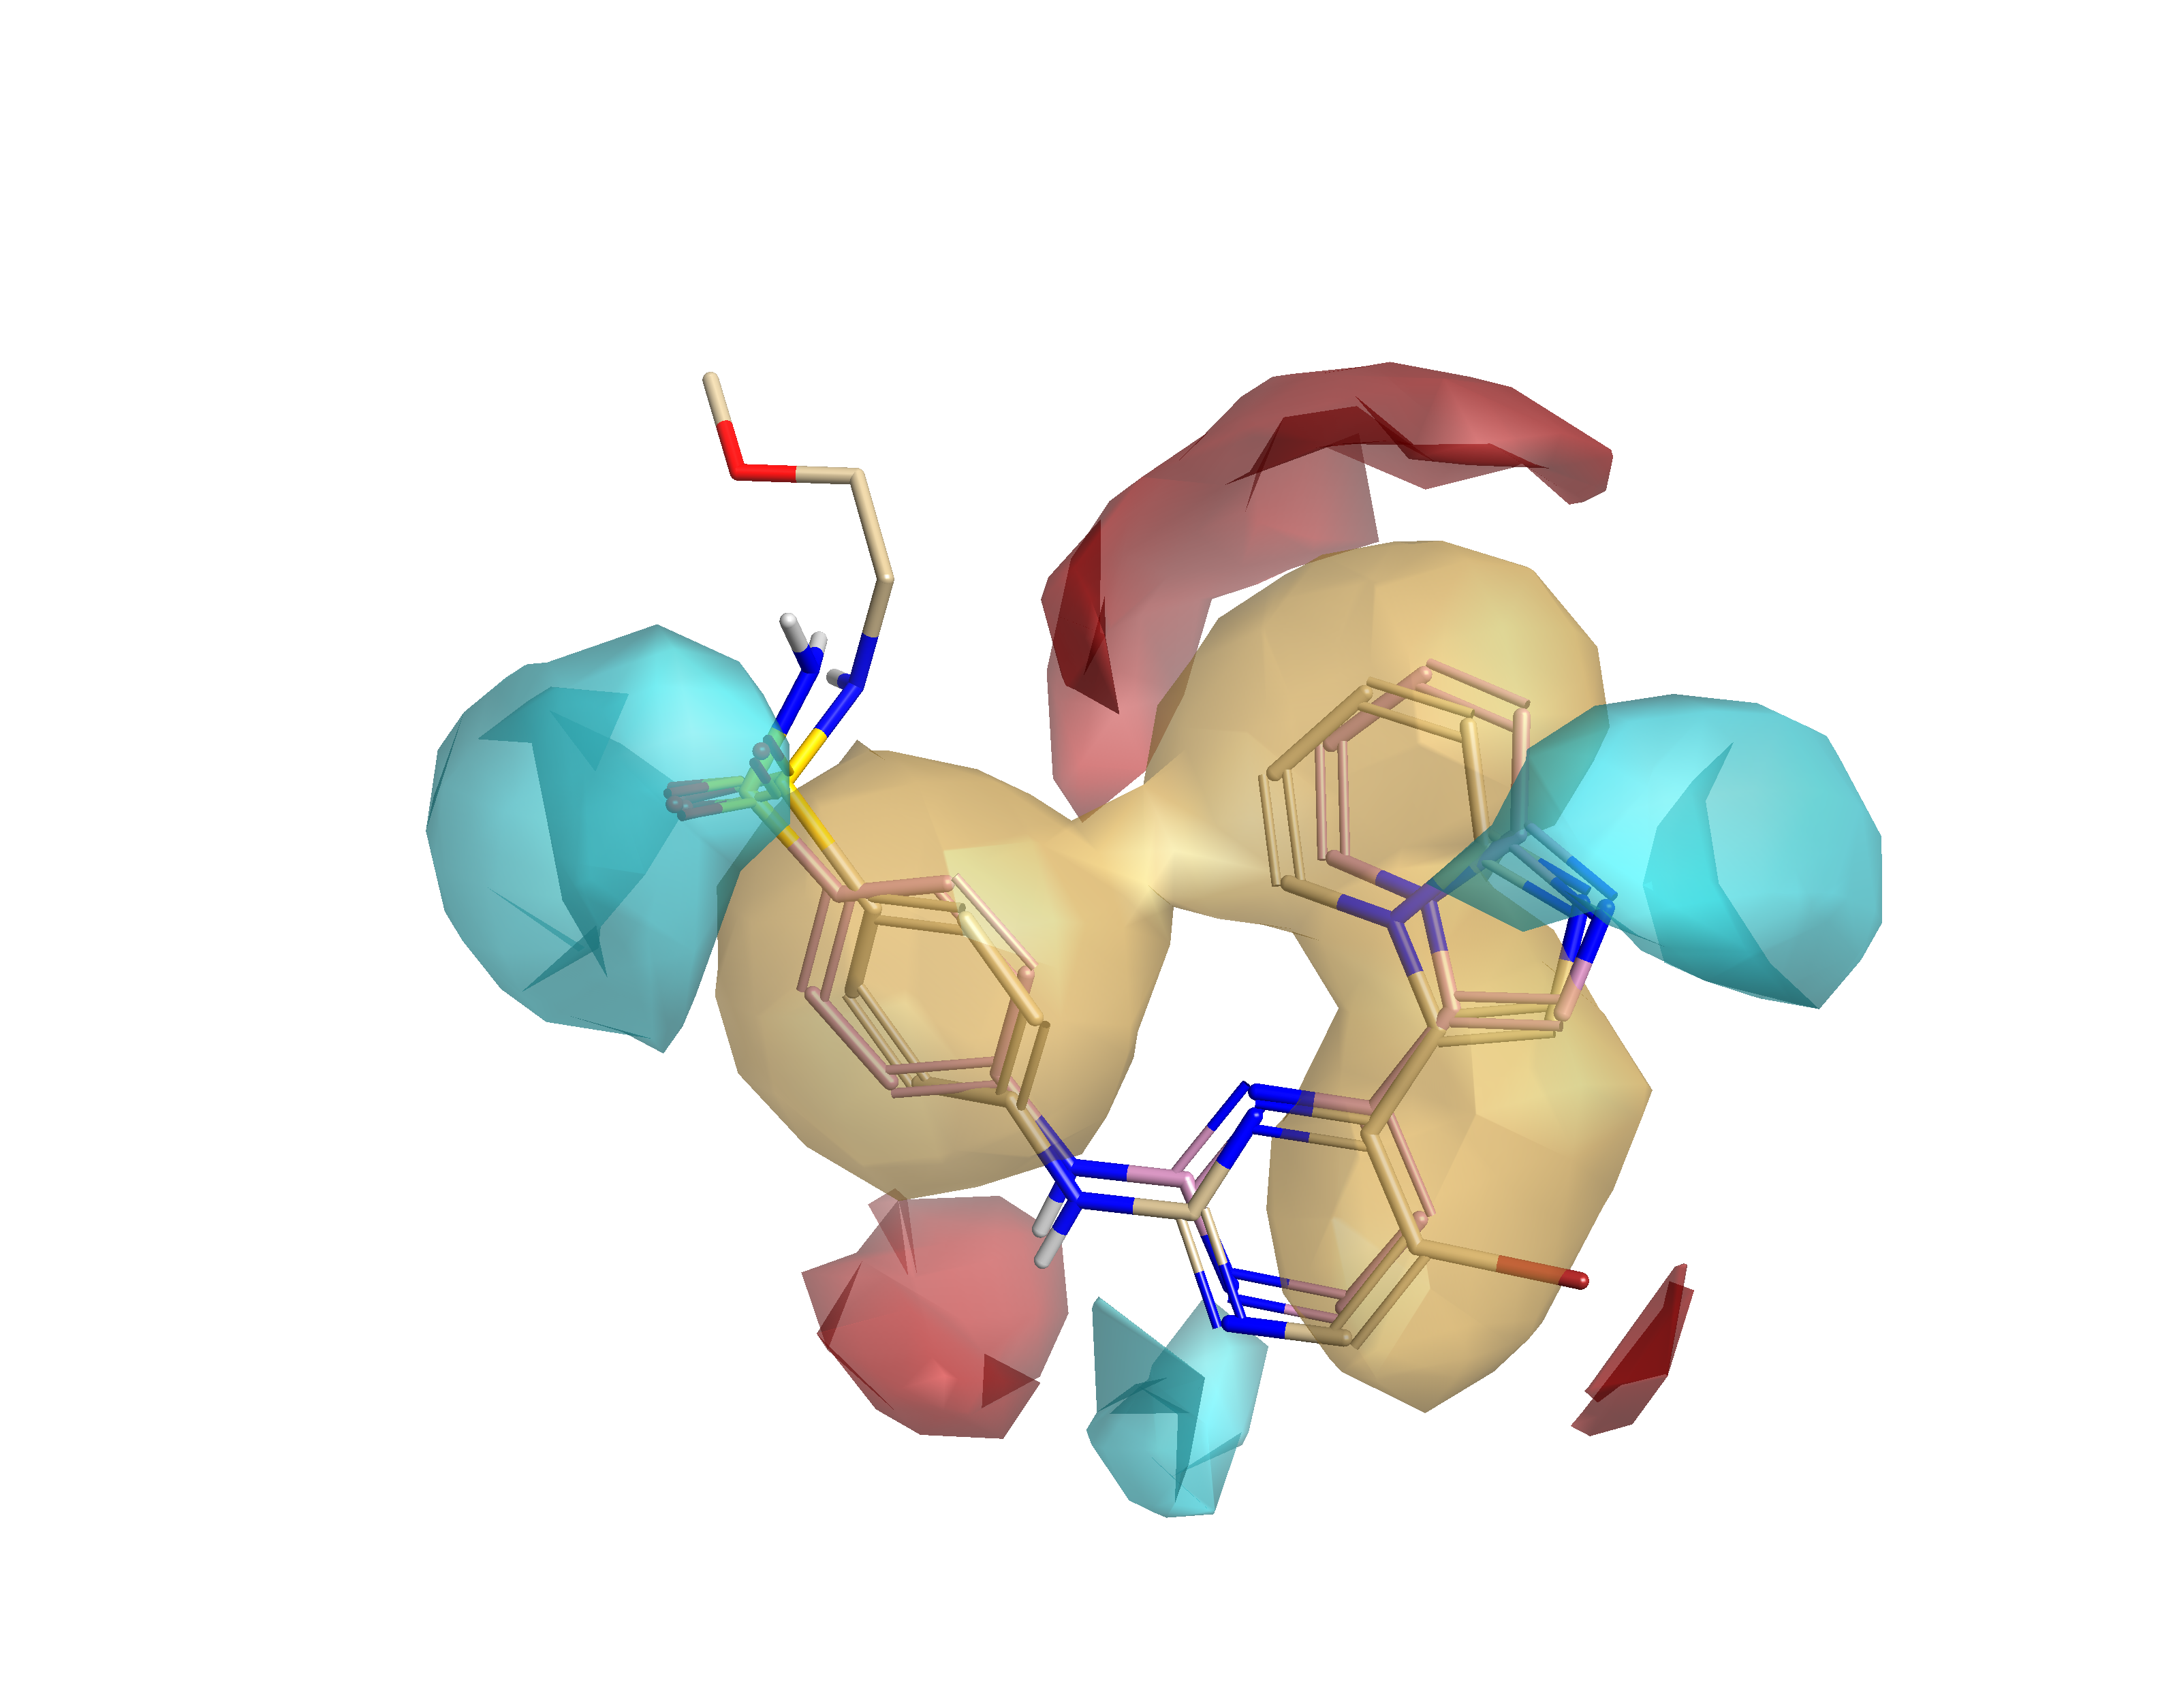
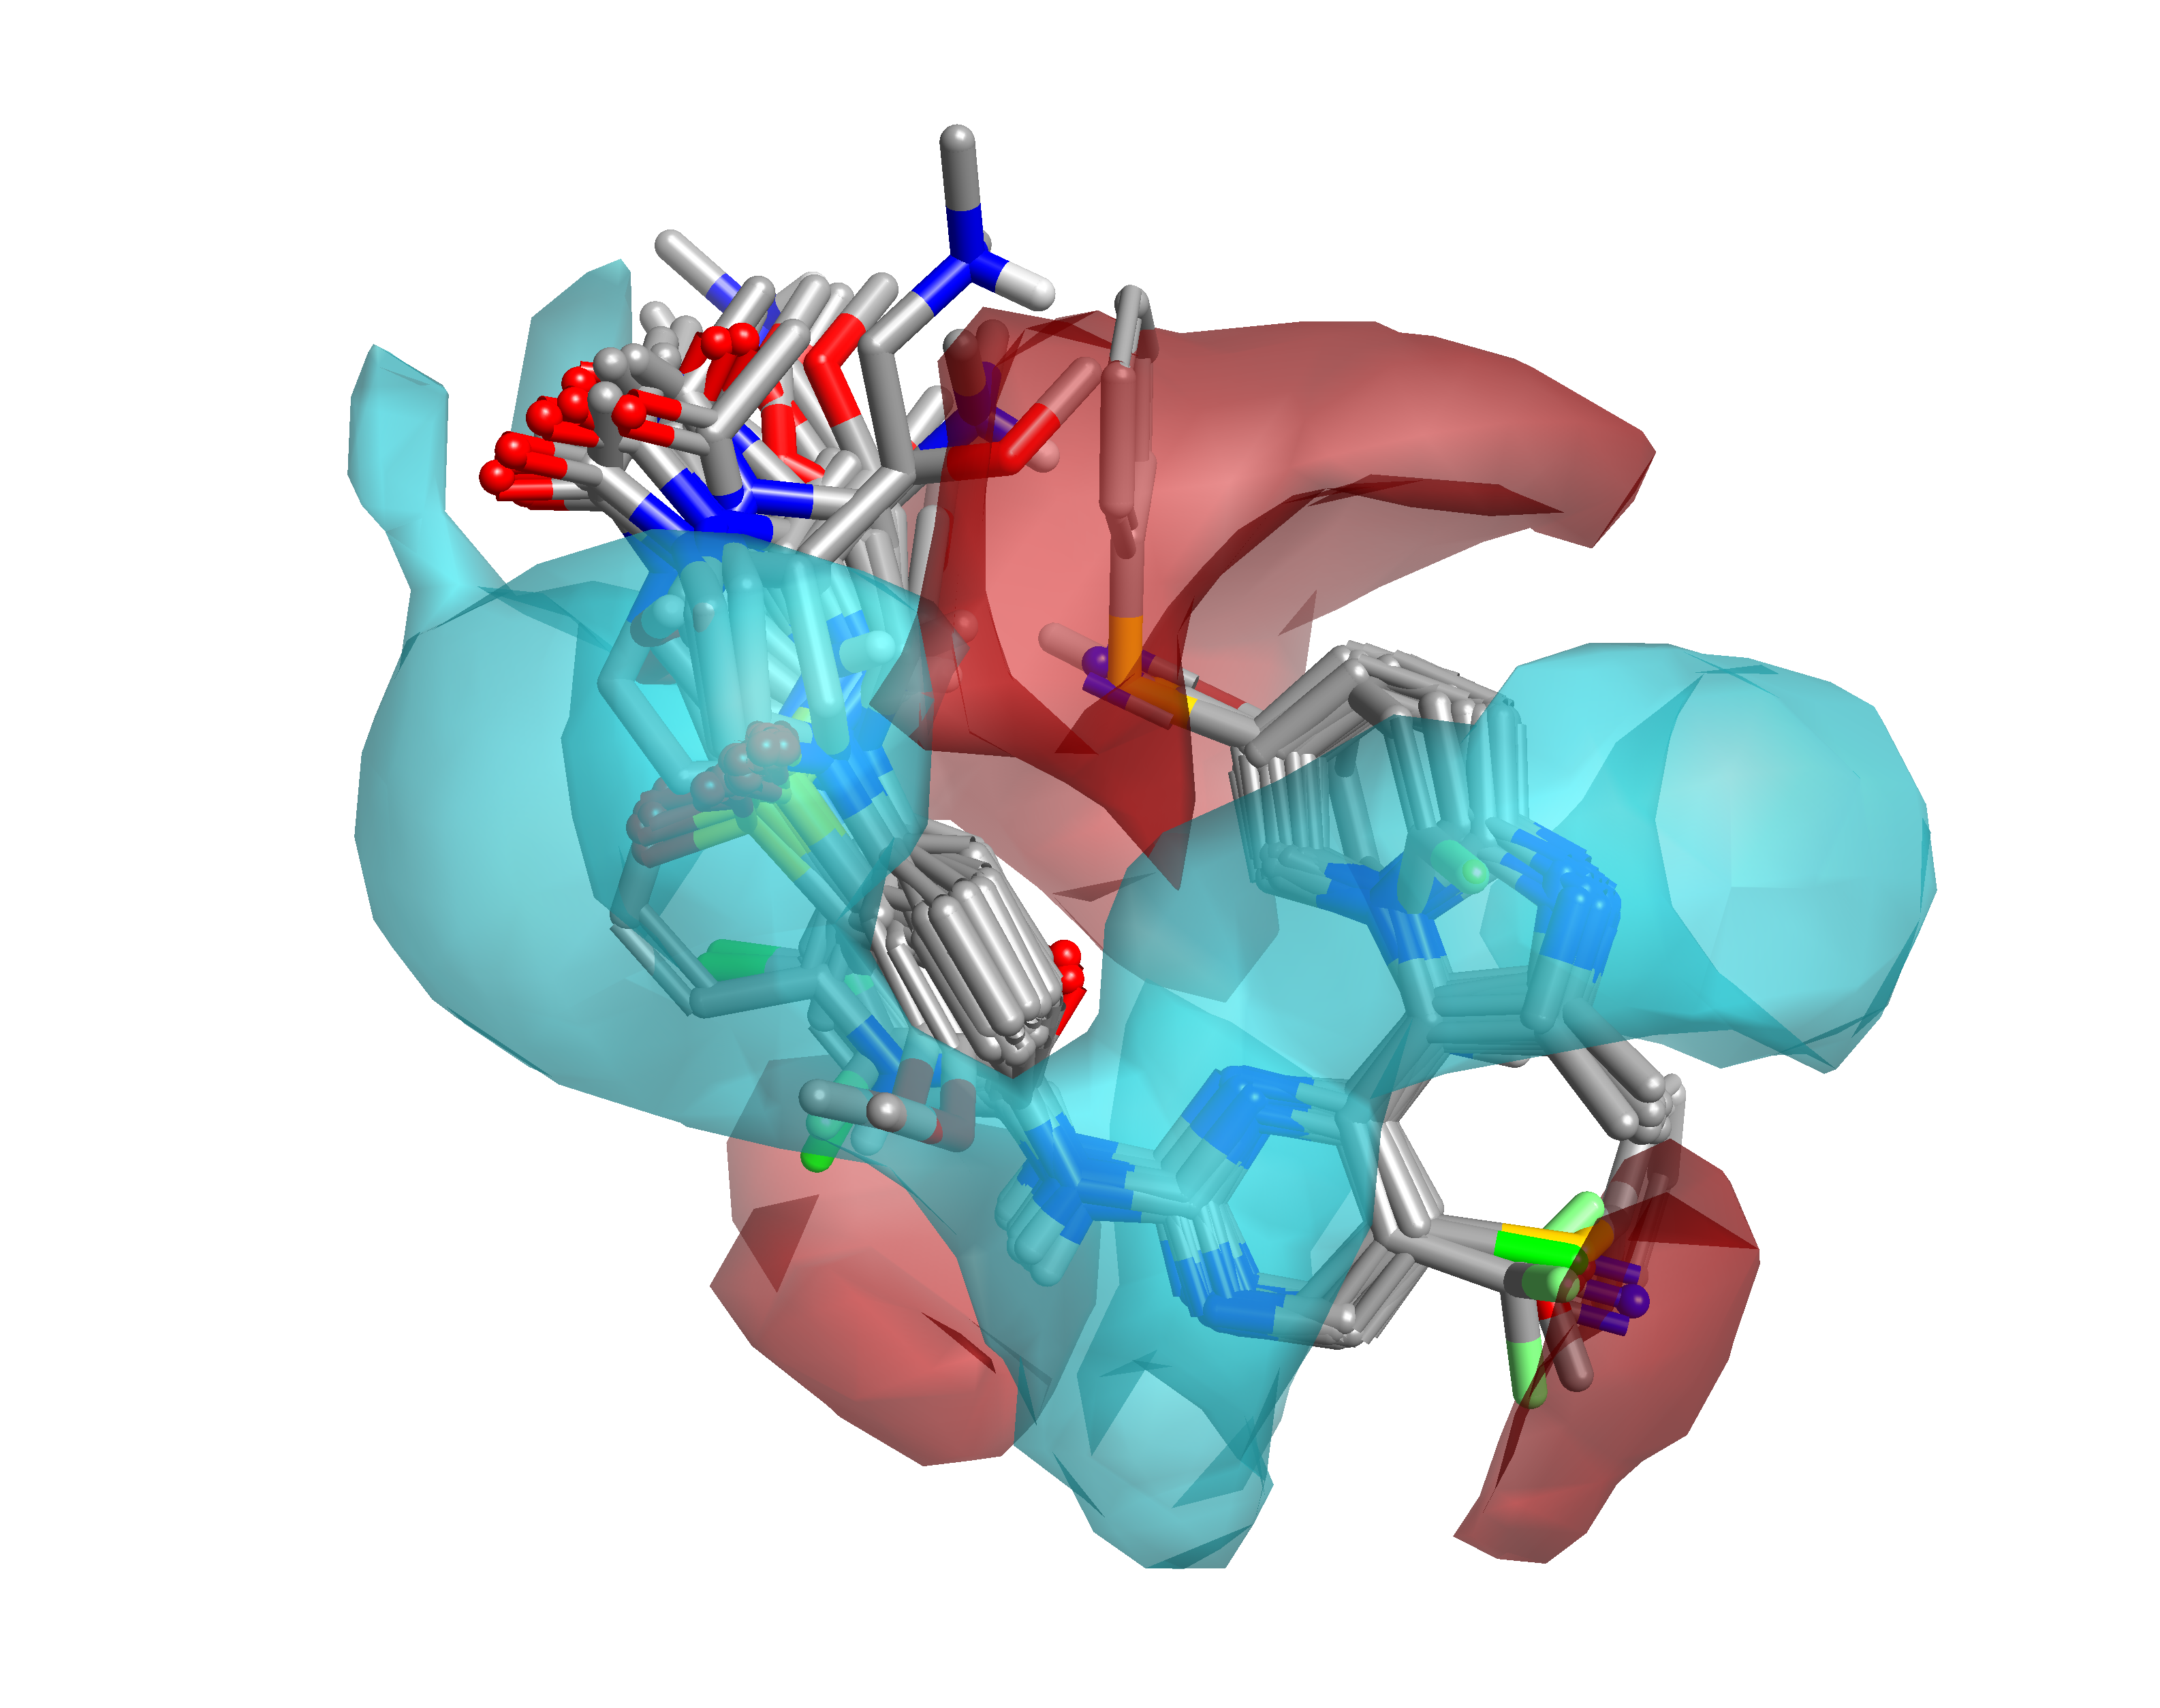
Figure 4 shows the summary of activity cliffs in electrostatics and steric space – the fine detail on the average of actives map. Areas that are blue suggest that making this area more negative (or less positive) could enhance activity; areas that are red suggest that making the area more positive (or less negative) can drive activity; and finally, steric bulk is favorable in the green regions, whereas it is not tolerated in the pink regions.
Figure 4 (right) displays the activity cliff analysis in an orientation better suited to examining the imidazopyridine. Tilted on its side, the Activity Atlas model suggests that a more positive/less negative π-cloud should enhance activity, as well as noting that a stronger negative near the H-bond accepting ring nitrogen should also favor activity.
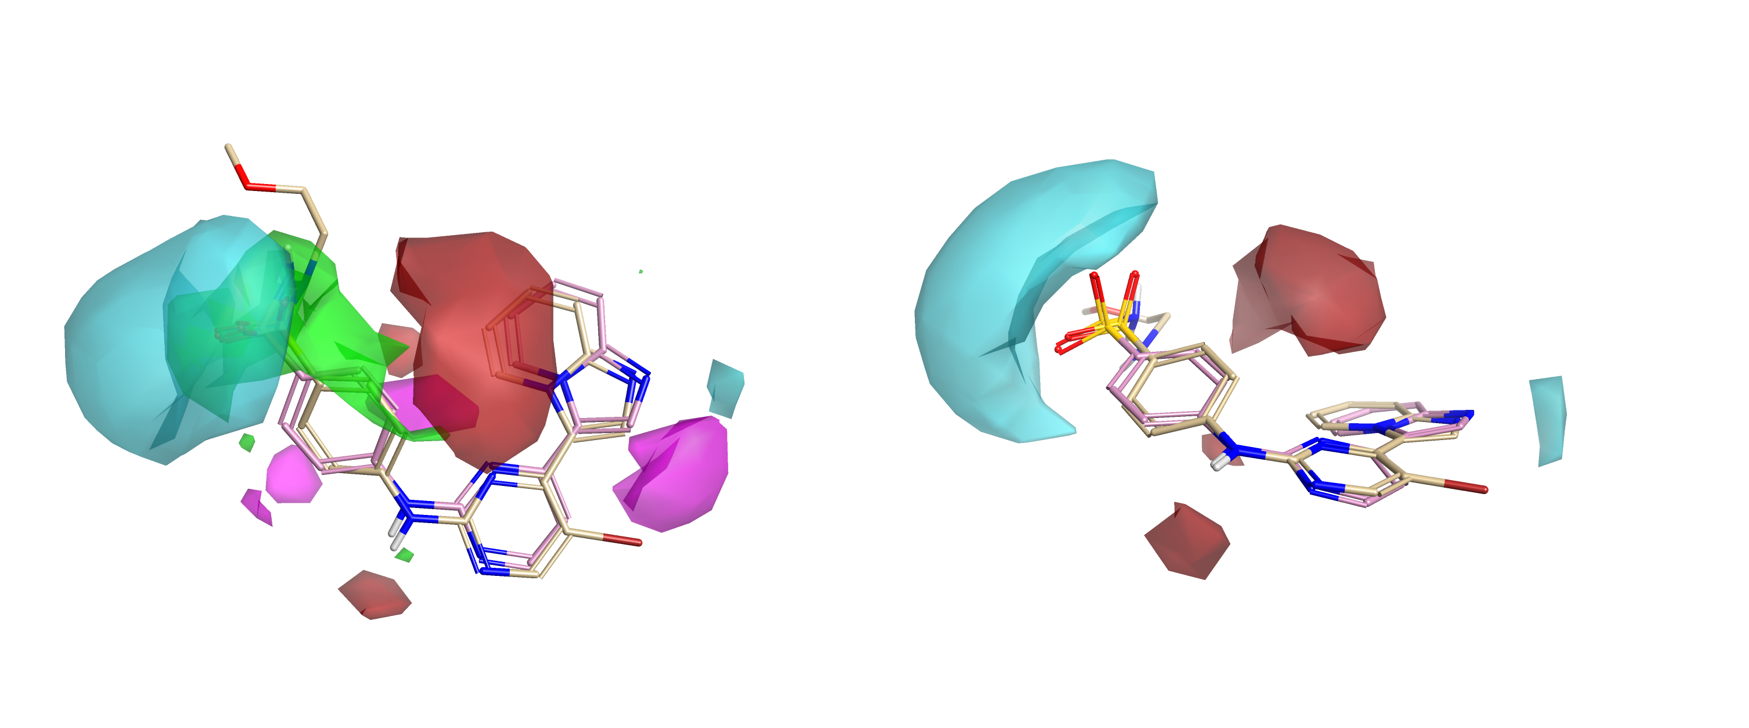
The assessment of the electrostatic regions explored suggests that at least 10 of 38 molecules have contributions as shown in Figure 5. This means that regions that are not explored may present opportunities for modification and further optimization.
The region explored analysis also performs a calculation of novelty for all the data set compounds as well and novel designs. The calculated novelty can be used as an indication for how much information would be gained from the molecule should it be made.
With a SAR analysis in hand, Spark was used to find bioisosteric replacements for the highlighted portion of
the 1OIT ligand as shown in Figure 6. The fragments were sourced from the Spark reagent database of boronic acids derived from eMolecules.
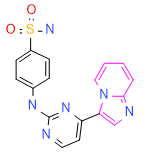
Four results were selected from the Spark experiment were selected for further analysis and are shown in Figure 7. Each of the selected Spark hits have been chosen to either enhance activity, and/or to challenge the model since it was built on a relatively small number of compounds.
Each of the proposed bioisosteric replacements are derived from commercially available reagents that are shipped from the supplier within 2 days to 4 weeks.
In (a), the pyrazolopyridine replacement would test the importance of the H-bond acceptor strength on the original imidazopyridine. Moving the heteroatom across the ring results in a weaker H-bond acceptor while maintaining a reasonable density above the ring. Note that this replacement results in a richer central pyrimidine ring.
The dihdropyrroloimidazole (b) has similar electrostatics to that starting ligand but tests the requirement for an electron deficient aromatic by saturating this ring, removing all pi-electrons from this region.
In (c), the benzofuran might be suitable for testing the model as it removes the strong H-bond acceptor altogether, replacing it with a weak feature. Whilst this might not be productive in activity the molecule would add knowledge to the model and the reagent is available immediately.
Finally, (d) suggests replacing the imidazopyridine with a quinoline. The change from 5,6 to 6,6 ring introduces a different geometry for the H-bond acceptor but maintains many of the electrostatic features of the starting ligand in a reagent that is available for immediate dispatch. If this substitution was tolerated then the spark results contain other, more exotic suggestions that include a H-bond acceptor in a 6 membered ring in this position.

This article presents our approach to answering the three questions at the heart of medicinal chemistry design:
Every chemist has a collection of tricks and substitutions that have been built up from their laboratory experience. Spark enhances the generation of ideas in an unbiased way, and in combination with a chemist’s intuition, can provide ideas about what compounds can be made that are in potentially open IP space, but still retain the characteristics of active molecules. The Spark experiment using eMolecules reagent databases also provides tier and ordering information for applicable reagents exploiting specific chemical reactions to improve laboratory efficiency.
Taking the Spark and chemist-designed ideas and examining them in the context of the Activity Atlas models is a way to ensure that new compounds meet the characteristics of active molecules, or conversely, are designed to test specific aspects of the models. The combination of average active molecule and activity cliff summary maps can provide the rationale needed to give confidence that taking a new design to the laboratory is worth the effort.
The region explored analysis combined with the novelty calculation within Activity Atlas can be used to assess whether the Spark and chemist-design ideas lie within the already explored chemical space, or whether they map regions of this space so far unexplored.
1 http://www.cresset-group.com/activity-atlas/
2 http://www.cresset-group.com/products/spark
3 http://www.cresset-group.com/products/forge
4 P. Bento, A. Gaulton, A. Hersey, L.J. Bellis, J. Chambers, M. Davies, F.A. Krüger, Y. Light, L. Mak, S. McGlinchey, M. Nowotka, G. Papadatos, R. Santos and J.P. Overington (2014) ‘The ChEMBL bioactivity database: an update.’ Nucleic Acids Res., 42 1083-1090.