Future-proofing Cybersecurity in Drug Discovery
The pharmaceutical and biotech sectors suffer more data security breaches than any other industry, with 53% resulting from malicious activity. To protect against potential ...
News
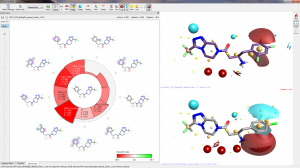
The substitution of aromatic groups provides a unique tool to moderate the potency and physicochemical properties of drug like molecules. However, the huge variety of substitutions that are possible can give rise to SAR that is almost impossible to understand, with small changes resulting in large shifts in potency. In these circumstances the understanding of the causes of the observed activity cliff is critical to progressing the project aims. This is an area where we at Cresset have always felt that using molecular interaction fields gives you a head start as you can model the electrostatic and shape properties of the molecule accurately. The release of the Activity Miner module for Forge and Torch significantly improves this process by detecting automatically activity cliffs in the SAR. Below we present a case study on a small set of changes around a set of reported DPP-IV inhibitors and show how the Activity Miner interface helps find the root causes of the changes in activity.
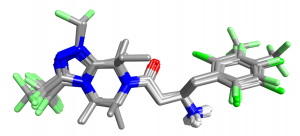
A set of DPP-IV inhibitors related to the ligands from PDB codes 2QOE and 2P8S were extracted from bindingdb together with IC50 values for enzyme inhibition. Using Forge, PDB 2QOE was downloaded and split into reference ligand and protein. The ligand from PDB code 2P8S was downloaded as a fixed conformation and aligned to the 2QOE reference using the default ‘normal’ settings then added as an additional reference molecule. The remaining 31 compounds in the dataset were aligned using the ‘Substructure’ method to these references with the maximum score against any reference being used to choose the alignment. The resulting alignments are shown below.
| row | Phenyl substitution | Activity (pIC50) | row | Phenyl substitution | Activity (pIC50) |
|---|---|---|---|---|---|
| 1 |  |
8.2 | 6 |  |
5.8 |
| 2 |  |
7.1 | 7 |  |
6.9 |
| 3 |  |
6.9 | 8 |  |
6.1 |
| 4 |  |
7.1 | 9 |  |
6.6 |
| 5 |  |
7.6 |
Clearly the SAR around the phenyl substituent is critical to activity but it is very difficult to decipher. However, with the combination of Activity Miner, field differences and the protein crystal structure we can get some pretty good hypotheses. (Note that all pictures below show field differences not absolute fields – regions where one molecule is more positive (red) or negative (blue) than the other.
The change of F to Cl in the 2- position (compare row 1 to row 2) is a slight increase in size but also introduces a small positive field at the end of the chlorine atom. It is interesting to note that the phenyl ring is slightly less electron poor when changing to chlorine (Cl is a better pi-donator than F). Taken together with the change of 2-F to 2-H (row 1 to row 3) there is a strong suggestion that this substituent should present a negative “end”. This is consistent with the protein crystal structure which indicates interactions with an arginine and the NH2 of an asparagine side chains.
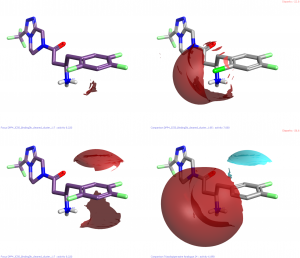
Removing the 4-F from row 1 gives row 5. Moving the fluorine atom in this position round the ring one position gives row 8. In both cases the activity is reduced by the change. The smaller change in activity when going from F→H suggests that introducing a negative region in the 3 position is additionally unfavorable. Neither of these hypotheses are obvious from the protein crystal structure where both the 3 and 4 positions interact with a number of residues of various types.
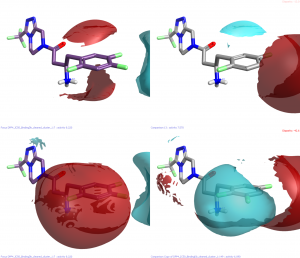
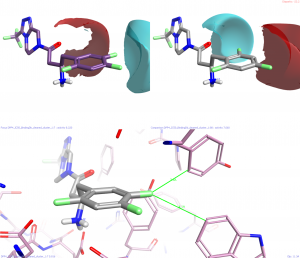
All the changes that remove the negativity from the end of the 5 position result in significant drops in activity whilst those that retain the negativity, even in the absence of other favorable interactions retain some activity. For example row 4 has both the 2 and 4 fluoro atoms but is only pIC50 7.1. The reason for this becomes evident on examination of the protein crystal structure. This atom points directly at the edges of the indole from tryptophan-659 and the phenyl of tyrosine-670 (numbers from PDB 2QOE).
This hypothesis is harder to establish as it comes from many observations. The most obvious is the change from row 3 to row 6 where there is a drop in activity from pIC50 6.9 to 5.8. Clearly this could be due to the increased size of the chlorine atoms but equally likely is the change in the electronic properties of the phenyl ring where highly electron poor rings have higher activity. This change is also observed where any of the fluorines of row 1 are deleted or where any atom is switched from fluorine to chlorine. Again the protein crystal structure helps to validate this hypothesis as the catalytic serine together with a couple of tyrosine residues point their respective alcohol oxygen atoms at the face of this ring.
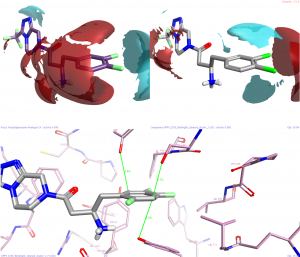
Many of our hypotheses could have been guessed at from studying the crystal structure of the 2,3,5-tri-fluorophenyl analogue in detail. However, the use of the field difference mode in Activity Miner brings the interactions into sharp focus and helps us rationalize the observations that we have. Subtle effects such as the difference between electron-rich aromatic and electron-poor aromatic rings are clearly visualized, explaining difficult and complex SAR in a way that is easy to interpret.
Our hypotheses can now be used in the design of new ligands with better IP or physicochemical properties with each design being validated against the regions of positive or negative field that we conclude to be important. Equally we could look for new ideas for this section of the molecule by using Spark together with the new reagent databases to suggest compounds (that we could make today!) that would retain the activity we have in this series while driving us into new regions of chemical space.