Improving PROTAC properties via single-point changes to linkers
We explore how computational methods can be applied to proteolysis targeting chimera (PROTAC) design, to effectively tackle some of the ...
News
The latest version of Torch, our 3D molecule design tool for medicinal chemists and synthetic chemists is now available. Torch uses Cresset’s description of a molecule’s shape and electrostatic character to help you understand the root causes of activity and use this to design new compounds. V10.4 has new functionality to aid decision making around new designs and an enhanced user interface.

Torch V10.4 has hundreds of improvements on the previous versions that will enhance your experience. If you are currently a user then get in touch for download links. If you haven’t tried Torch before get your free evaluation.
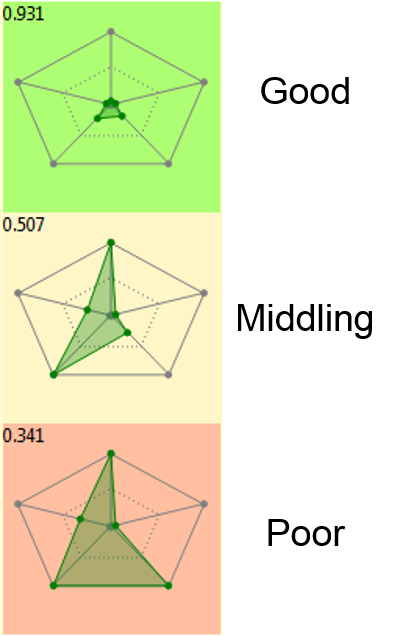
Figure 2: Enhanced Radial Plot
In Torch V10.3 the Radial Plot was introduced to provide a graphical representation of numerical data. In particular it created a simple picture to show how a molecule fits the physicochemical profile of a project with the idea that parameters are within an ideal range, an unacceptable range or somewhere in between. V10.4 enhances this representation by combining all the scores in the Radial Plot together into a single number scaled between zero and 1 (Figure 2).
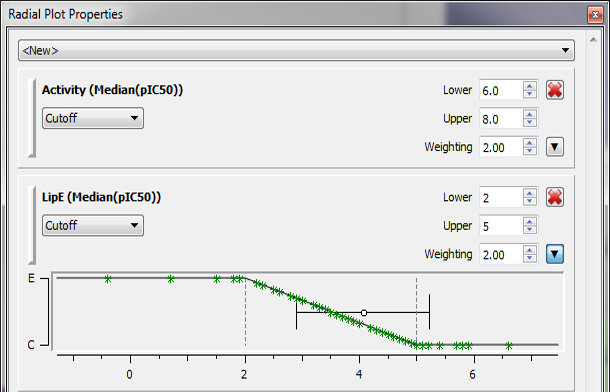
Thus compounds with a radial plot score of 1 fit the project profile perfectly while those with zero lie outside the desirable property space in all aspects. Since not all properties are equally important, Torch enables a weighting factor that can be applied to each property (Figure 3). The weight is used to scale the contribution to the final score. This is useful when you want to focus on one property more than another, for example you are prepared to have a non-ideal value for MW if the logP and TPSA are within the ideal range or you want a visual representation of that property but not have it count towards the score.
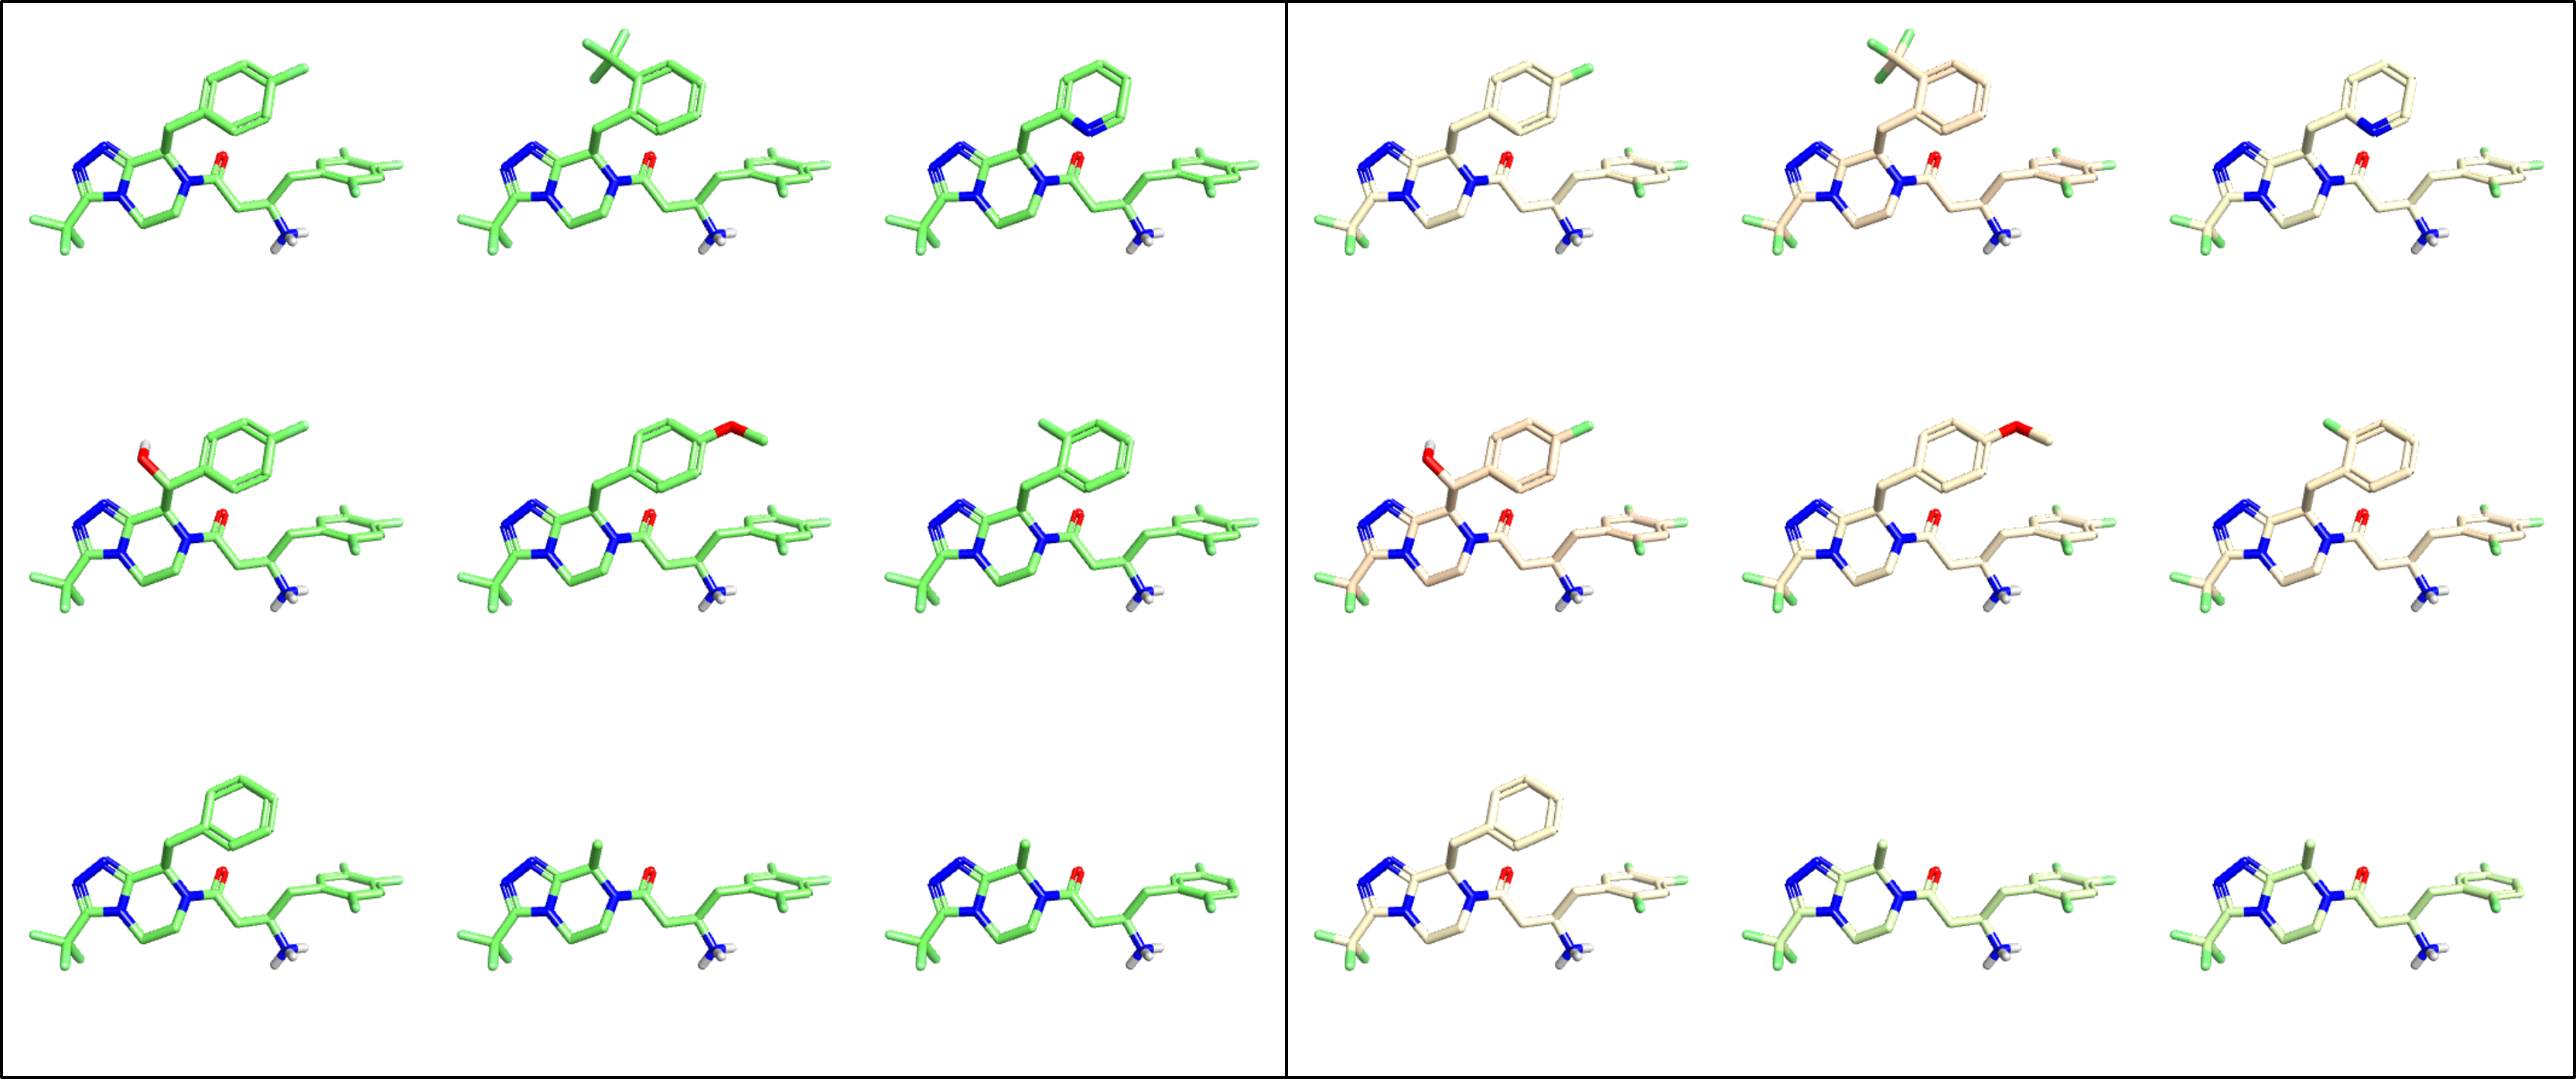
Coloring of molecules in the 3D window now has options to apply a color scale based on any numerical property in the molecule table including the new radial plot score (Figure 4). This simple feature requires you to define how the scale should be applied to the numbers (by means of the Radial Plot property configuration). Once this is complete you are able to investigate how the 3D alignment and shape of molecules varies with the individual physicochemical properties and the overall project goals.
This release enhances Torch’s ability to study SAR in multiple ways. You can now divide molecule datasets into separate sections, tag any molecule with an arbitrary text based label benefit from improved plotting capabilities to study numerical data and select molecules.
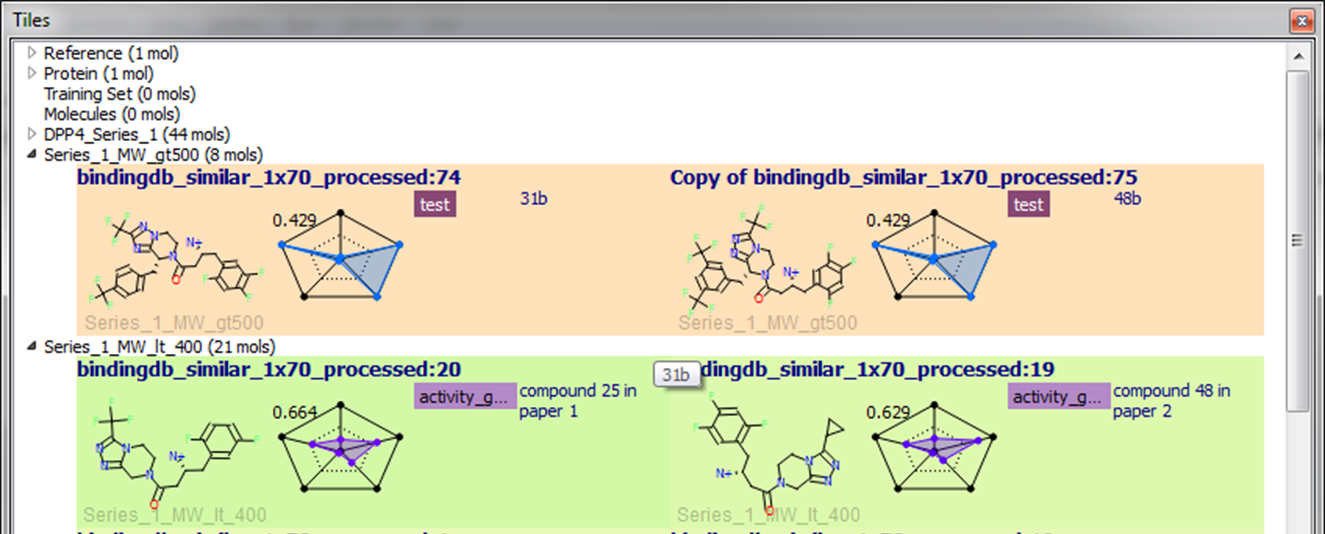
Molecule roles were introduced in the first release of Forge to enable it’s 3D-QSAR functionality. However, we found that we use this functionality extensively even when we are not interested in 3D-QSAR, for example, to group compounds into series or split out those that are designs from those that have been tested or are out for synthesis. We use molecule Roles (Figure 5) to help cluster datasets using 3D similarity with Activity Miner, to look at different sub-groups, as well as for the original purpose – 3D-QSAR. In bringing this functionality to Torch we are sure you will find it equally useful.
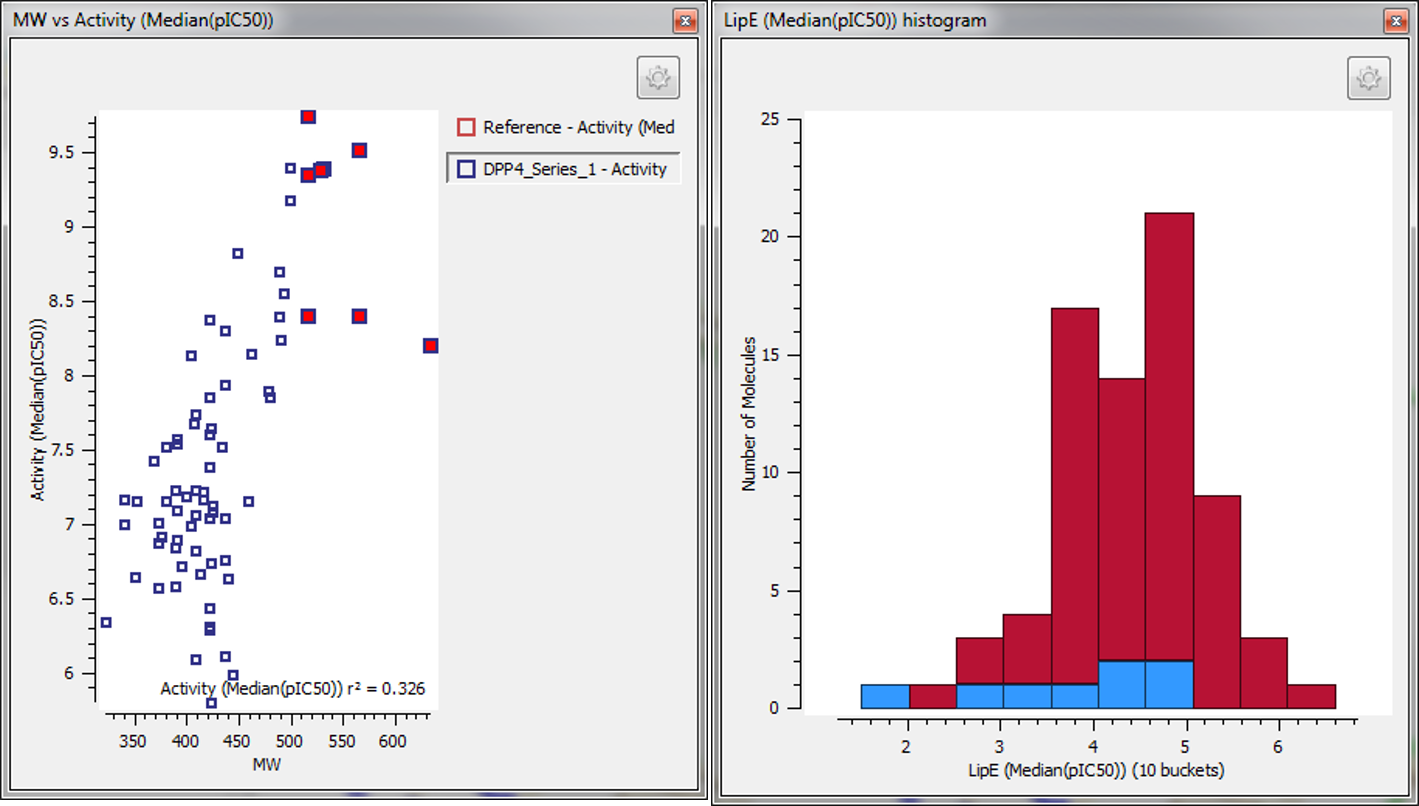
Plotting histograms and scatter plots is now possible with Torch V10.4 (Figure 6). This simple enhancement comes with interactive selection of molecules and significantly improves the study of molecule properties across a dataset or within a role. For example, selecting a molecule in a scatter plot of Activity vs logP highlights the selection in a histogram of MW. Combined with the display of the selected in the 3D window it provides added flexibility in SAR analysis.
To complement Tags and Molecules Roles we have introduced the Tiles view of molecules that has been so popular in Spark. This view presents any of the data that is in Torch on a tile and enables you to focus on the information that is important to you at the same time as seeing as much of the dataset as you can.
In Forge, Activity Atlas models have been introduced as a new way of summarizing your SAR in a simple yet detailed 3D view (Figure 7). In Torch these models act as templates to design new molecules. They are present in the 3D window and also in the editor to enable the interactive design (in 3D) of molecules that explore new regions of SAR or help you focus on maintaining activity while perfecting your macro-properties. We are confident that Activity Atlas models will transform your view of molecule design.

To try the new features in Torch V10.4 simply download a free evaluation or contact us for download links.