Future-proofing Cybersecurity in Drug Discovery
The pharmaceutical and biotech sectors suffer more data security breaches than any other industry, with 53% resulting from malicious activity. To protect against potential ...
News
In this blog post I’m going to look at 3D-QSAR in Cresset’s software. I will share some of my experience on the best way to do it and, more importantly, what not to do.
3D-QSAR is one of those techniques that everybody loves. When it’s done well you get quantitative results, validation that the model actually has some predictive power, estimates on the limits of that predictive power and you also get interpretable pretty pictures that give a better mental picture of what the protein wants in its ligands. What’s not to like?
The flip side is that 3D-QSAR is hard. It’s difficult to get a good model, it can be difficult to interpret a model once you’ve got one and it can be frighteningly easy to obtain an invalid model if you are not careful. The reason for this is that 3D-QSAR, unlike most 2D-QSAR, has noise in the inputs.
When you run a traditional 2D-QSAR model you need to select from a wide array of numerical modeling methods. Are you going to use support vector machines? Gaussian process models? Feed forward neural networks? Random forests? There are lots of these to choose from, and usually a wide variety of parameters to tweak in each case, but the inputs to the models are almost invariably fixed by the data set. Each molecule gets a set of molecular descriptors based on the 2D molecular graph, from simple fingerprints to the literally thousands of exotic extensions of these that have been proposed over the years (Edge adjacency indices! Randic molecular profiles! Weiner polarity numbers!) But the one thing these have in common is that they are uniquely determined by the 2D molecular structure. For example, the ECFP4 fingerprint of a molecule isn’t an estimate. It has no error bars. As a result, in 2D-QSAR you often have a variable selection problem, but the variables themselves are exactly known and completely fixed.
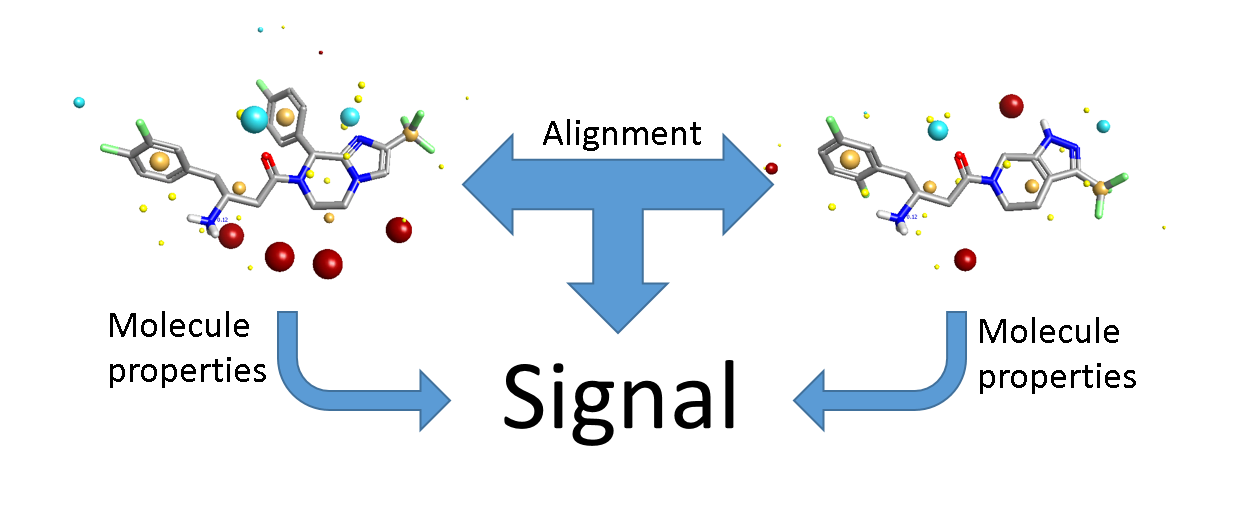
3D-QSAR is different. The input is a set of aligned molecules. In general we don’t know what the correct alignment is. Even when you have multiple protein crystal structures, you’re unlikely to have every molecule in the data set represented and even then you have the issue of how best to align the proteins! In a 2D model, the input data for each molecule is independent. In a 3D model, this is no longer true: you are considering not only the properties of each individual molecule, but also the relationship between the molecules (Figure 1). There’s more signal, but also more noise. The key to 3D-QSAR is making sure that there’s more of the former.
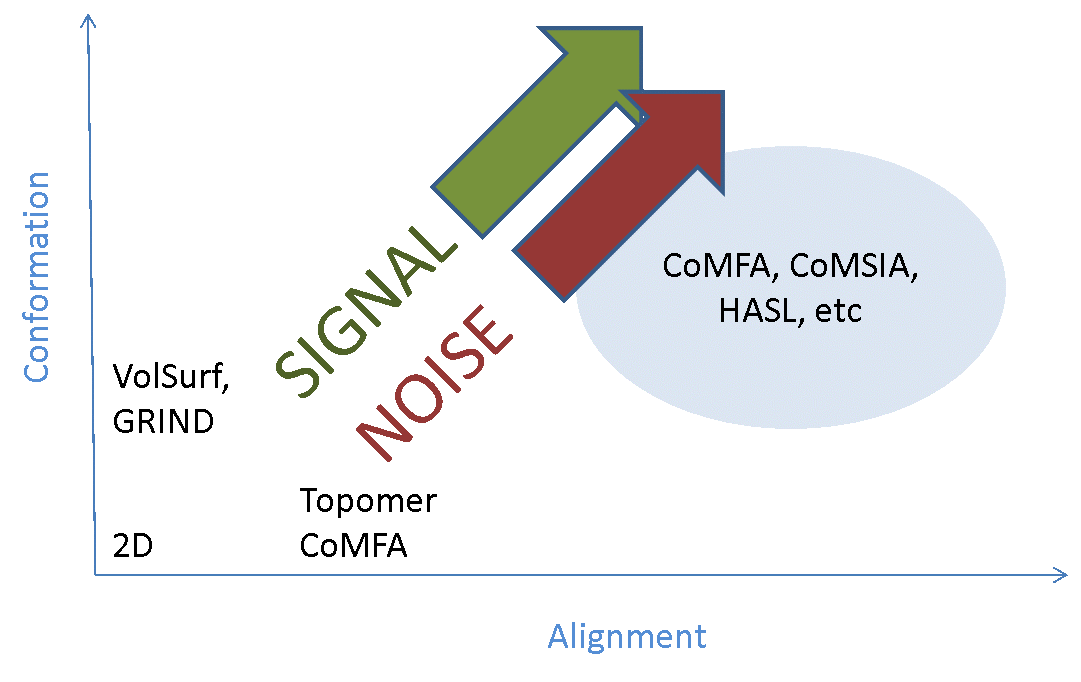
The majority of the signal is in the alignments, so you need to get those right. If your alignments are incorrect your model will have limited or no predictive power. Traditionally alignment has been done largely by hand – we’re generally modeling compounds within a series, so you align the cores and then tweak the substituents until it looks about right. This can work well, but with caveats that I’ll come to later. However, it’s tedious and error-prone, so there have been many attempts to work round the problem by developing ‘alignment-free’ 3D-QSAR methods (such as GRIND and template CoMFA). These successfully remove the alignment noise (more or less), but only at the cost of completely removing the alignment signal – they’re not really 3D methods any more. If your method doesn’t depend on alignment, then it’s at best 2.5D. If it also doesn’t depend on which conformer you use (or uses a single arbitrary 3D conformer), then it’s a 2D method in disguise (Figure 2).
For most data sets I find that you need 3-4 reference molecules to fully constrain all of the others. The substructure alignment algorithm in Forge and Torch ensures that the common parts of the molecules are aligned as closely as possible, while still ensuring maximum electrostatic and shape similarity for the rest.
At this point, I’ll tell you what you shouldn’t do, but everyone does – hit the ‘Process’ button, run a QSAR model and go look at the activity plot to see how well we did (Figure 3).
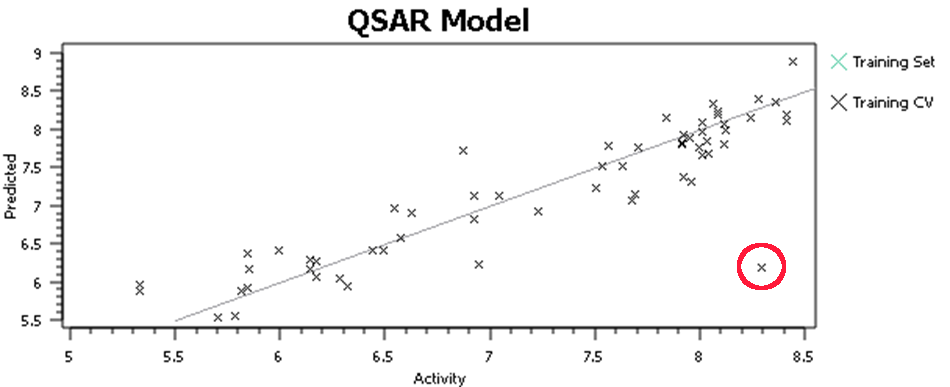
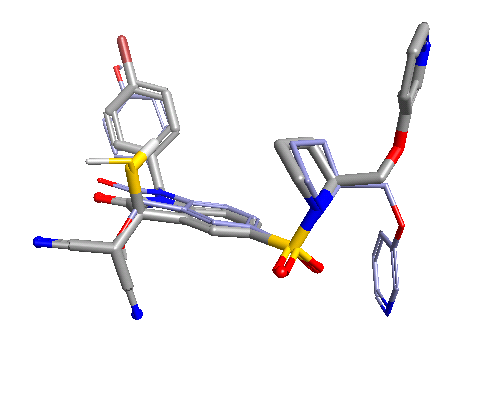
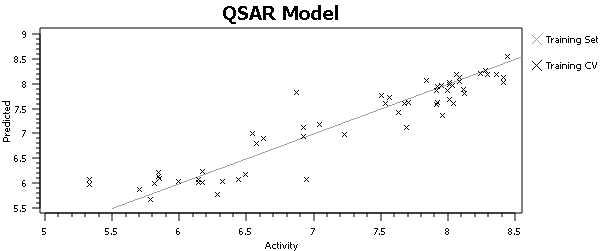
This, or a variant of it, is what everyone does when doing 3D-QSAR, at least until they know better. It’s wrong. Why is it wrong? We’re altering the input to the model based on the output from the model – the input data is no longer independent. Re-aligning that molecule improved the model, but who’s to say that spending the same care and attention on the alignment of all of the other molecules wouldn’t make the model worse? The problem isn’t manually tweaking the alignments, it’s doing so on some molecules rather than others based on the model outputs. For similar reasons, you shouldn’t spend more time aligning the highly-active molecules than the inactives. The alignments provide the X data in our regression: you must not change the X data while paying attention (either directly or indirectly) to the Y data (the activities).
Spend lots of time making sure your molecules are aligned. Do it before you run the QSAR method, and pay no attention to activity values while doing so. Once you’ve hit the QSAR button, you’re tainted, and are not allowed to tweak the molecules any more.
When developing our 3D-QSAR software, we did rigorous testing on literature data sets. There are fewer of these than you might expect: the number of papers that present a CoMFA analysis and then provide the molecules only in SMILES form (or not at all) is quite frankly astonishing. We get virtually the same q2 on average as CoMFA does on these sets, which isn’t that surprising given the self-selected nature of these. It’s hard to get a bad q2 published, after all. The scary thing was the control experiment we ran. We turned off all of the nice electrostatics and shape descriptors, and put a simple grid on each molecule. The values of the grid were either 1, if inside the vdW surface of the molecule, or 0 if not – a simple indicator variable for space filling. CoMFA models generated using this volume indicator variable were statistically indistinguishable from the original CoMFA data – the average RMSE was slightly worse, but not significantly so (Table 1).

3D-QSAR is a great technique – once you have a model it can, quite apart from providing useful predictions, give you great insights into the SAR of your series. Just remember: all of the signal is in the alignments. Align your molecules well. Check them, fix them, check them again. Check them once more. Then, and only then, should you press the QSAR button. Good luck!
Contact us if you would like to find out more about 3D-QSAR in Cresset’s software.