PyFlare is an advanced and robust Python® environment, available within Cresset's CADD workbench FlareTM, capable of supporting open-source scientific Python libraries and code bases. PyFlare works interoperably with native Flare functionality via the Flare Python API, to further expand the vast portfolio of Flare’s molecular modeling functionalities. PyFlare gives the freedom to develop custom features and automate workflows to further accelerate molecule design projects.
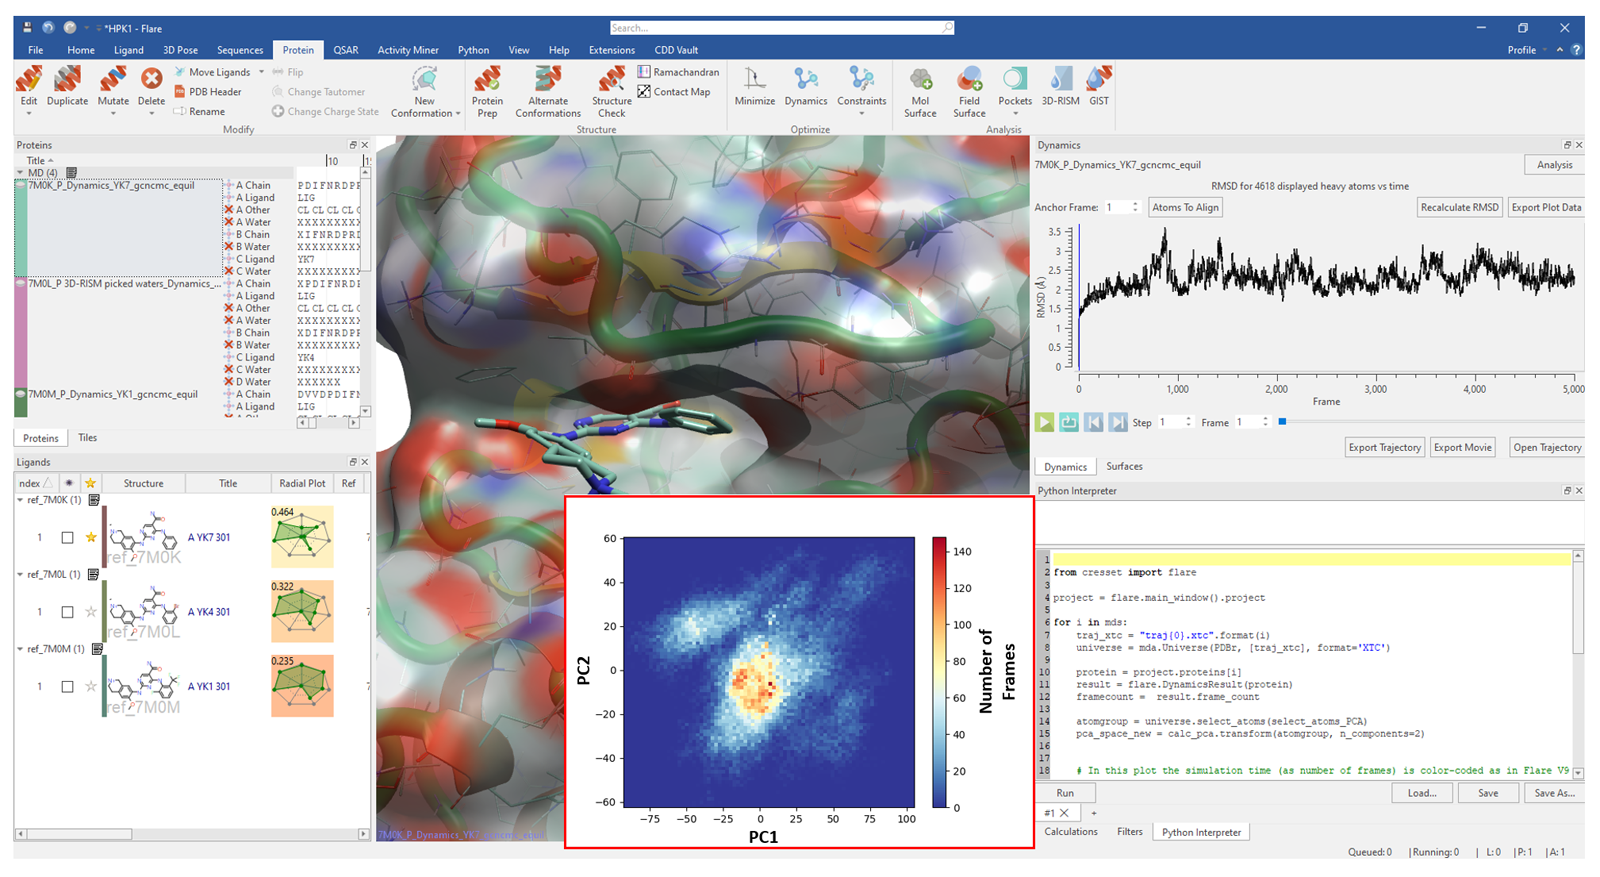
In this article, we will showcase some examples within a drug discovery context where the pyFlare environment has been further expanded with advanced data visualization and calculation functions. Specifically, we will present workflows for chemical space visualization, compound clustering, ensemble PCA and retrieval of compounds by name from PubChem.
This article demonstrates how adaptable the pyFlare environment can be, to host a wide variety of unique Python libraries to support your drug discovery efforts.
Chemical space visualization
Being able to chart the chemical space explored by a virtual screening experiment is key to identify recurring substructures and chemotypes, ensuring that the compounds prioritized cover sufficient chemical diversity. Using RDKit1 and scikit-learn2 functionality (both available within the pyFlare environment) alongside Pandas and Plotly, it is possible within Flare to generate informative chemical space visualizations based on 2D descriptor similarity.
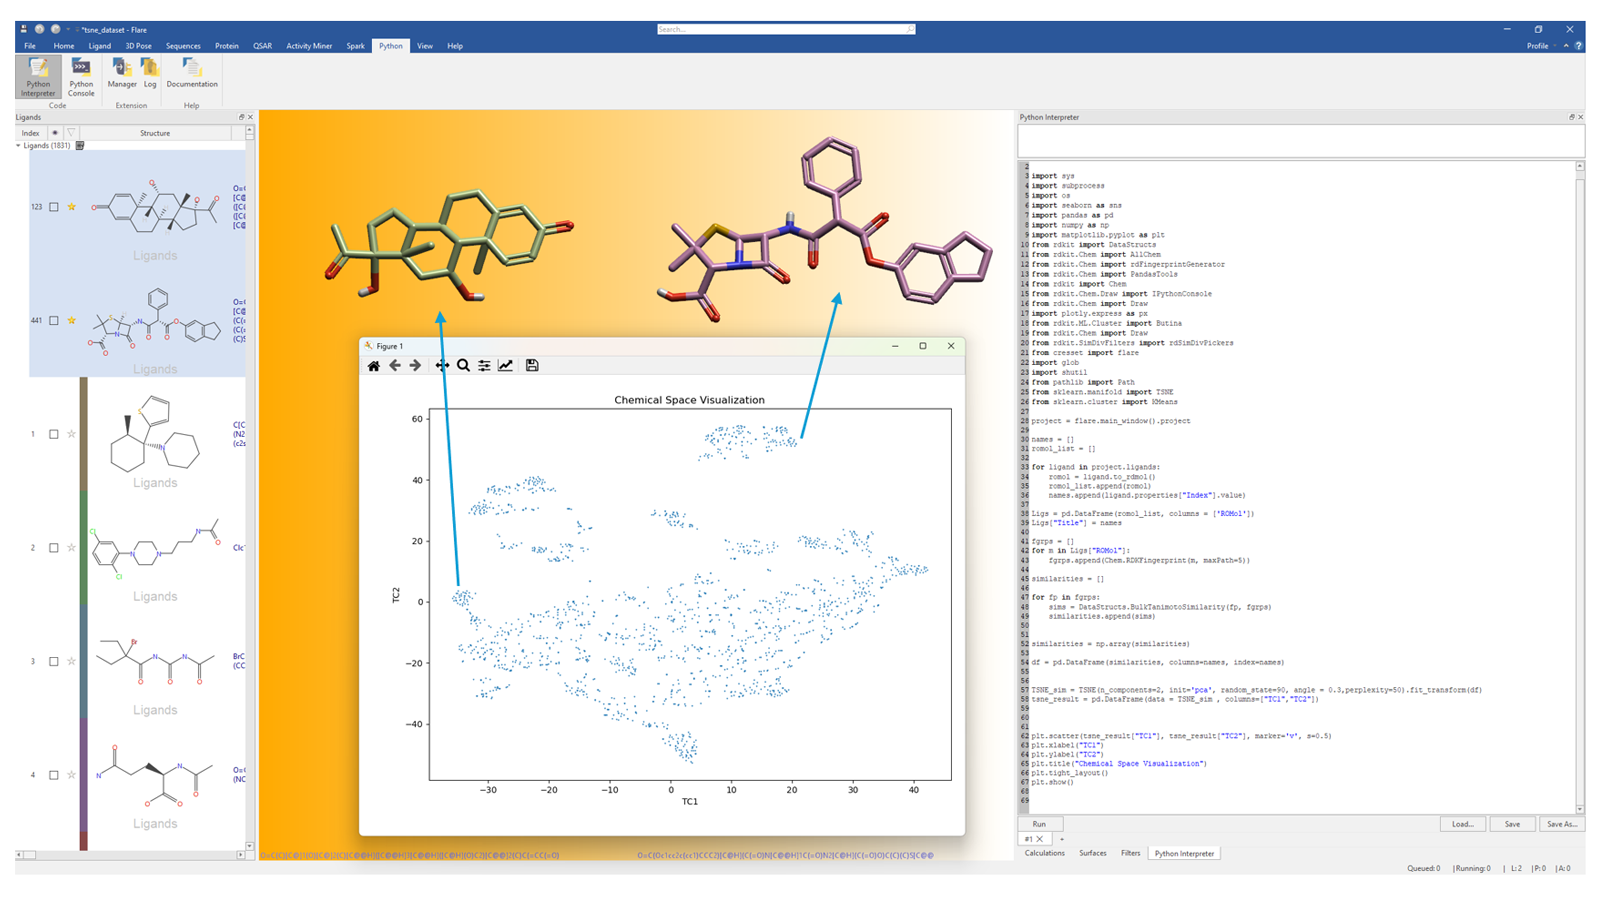
Figure 1 shows an example of t-Distributed Stochastic Neighbour (t-SNE)3 dimensionality reduction for a dataset of approximately 1.8 K ligands stored in the Flare Ligands table. A Python script written directly into the Flare Python Interpreter window builds an all-by-all Tanimoto similarity matrix, constructed from RDKit's 2D Morgan/Circular fingerprint descriptors, and projects this in two dimensions. From the t-SNE projections, it is easy to visualize distinct chemical clusters in the 2D similarity space, corresponding to distinct chemical series. The distances between datapoints reflect their 2D structural dissimilarity.

Figure 1. t-SNE projections into a 2D chemical similarity space for a dataset of chemically diverse ligands loaded in Flare. The t-SNE plot was generated by means of a Python script written directly into the Flare Python Interpreter widget.
Chemical series clustering
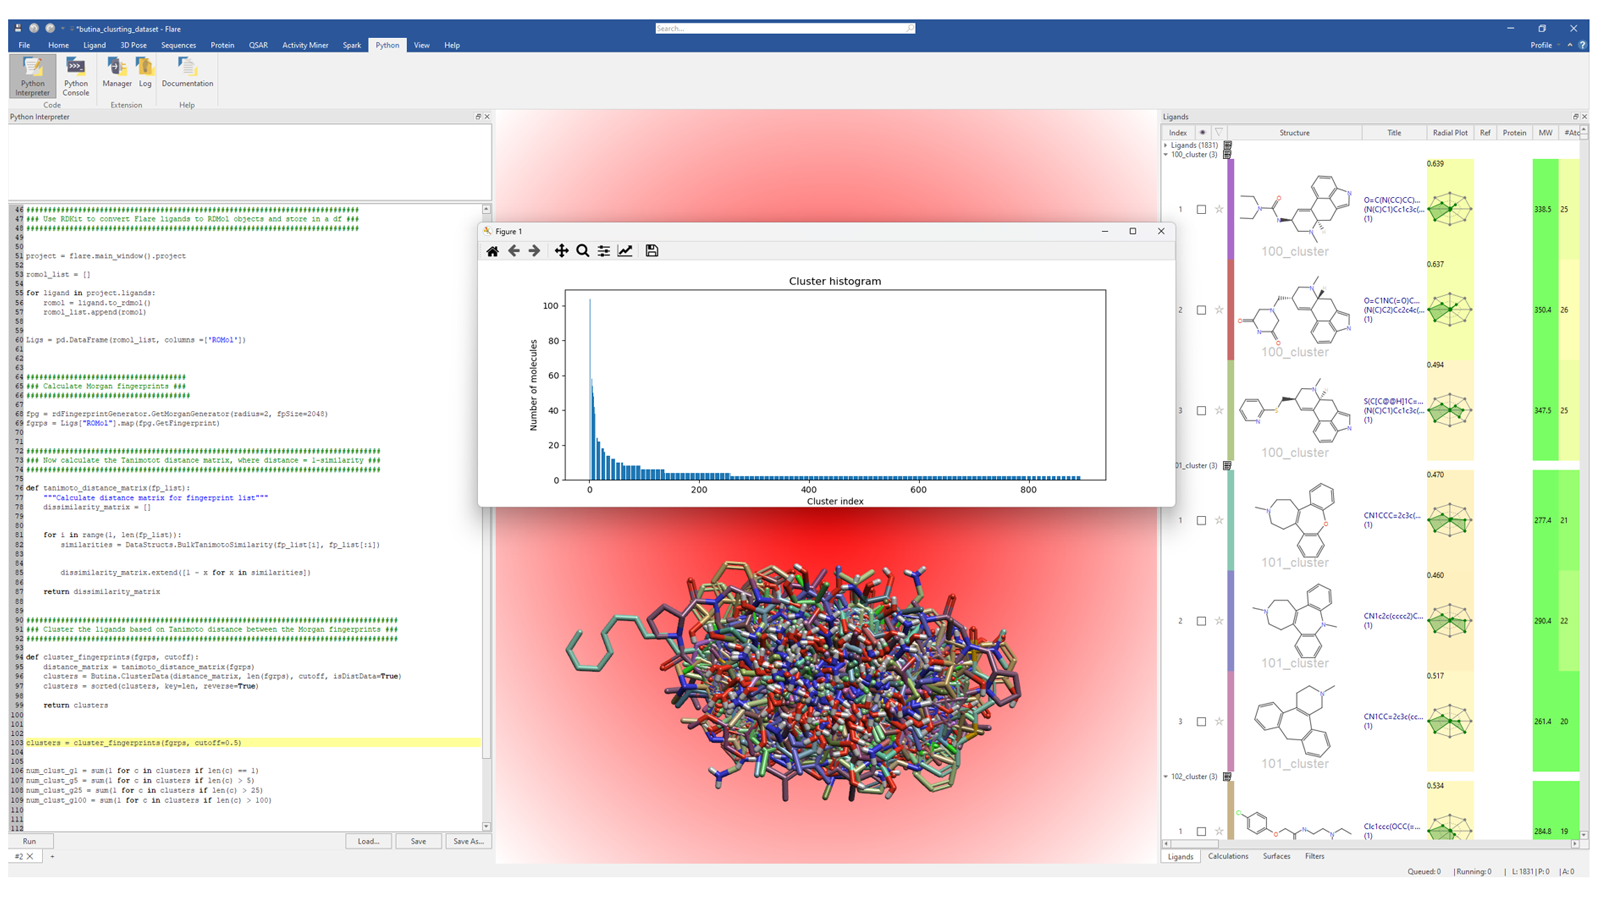
The same Python libraries used in the previous example (i.e. RDKit, Plotly and Pandas), can also be used to cluster ligands using Butina's algorithm,4 to organize the sampled chemical space into discrete clusters. More specifically, when using the Butina clustering algorithm, cluster centroids exhibit high similarity to their fellow cluster members, with an intra-cluster similarity reflective of the Tanimoto threshold chosen for the clustering. This represents an alternative to the hierarchical clustering method based on 3D/2D similarity natively implemented in Flare. In Figure 2, a Flare Python API script in the Python Interpreter was used to process the ligands stored in the Ligands table into 'Butina clusters'.

Figure 2. This Flare Python API script groups the ligands in the Flare project into separate, structurally compact clusters using Butina clustering. The number of molecules in each cluster is shown in the histogram.
Downloading ligands directly from PubChem into Flare
Flare offers multiple ways to add ligands to a project. They can be imported from a variety of standard file formats, drawn manually in the 3D window using the Editing tools, or created by typing their SMILES strings. It doesn’t, however, create molecules from their chemical name. Encouragingly, this can be overcome through the Flare Python API, making use of PubChemPy,6 an open-source Python library providing a way to interact with PubChem in Python through Flare.
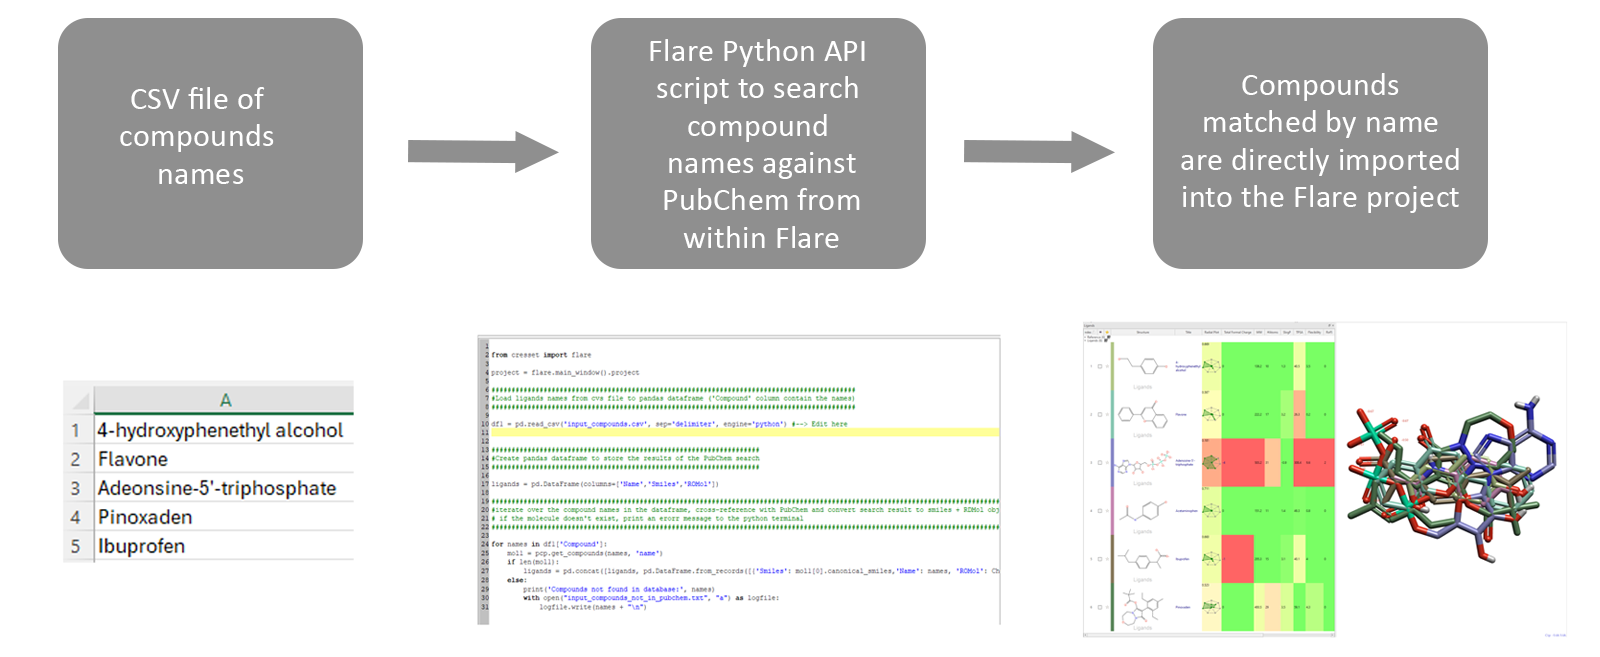
Starting from a list of compound names stored as a CSV file, a Flare Python API script can be launched within a live Flare session, reading the compound file, and searching the PubChem database for entries matching by name, as shown in Figure 4. This can be extremely useful when, for example, you are looking to load into the Flare GUI compound catalogues which do not include SMILES strings or 2D/3D coordinates for their compound entries.

Figure 4. A workflow to download compounds from PubChem into Flare based only on a supplied compound name.
Conclusions
The examples shown in this blog post illustrate how the pyFlare environment is compatible and can be easily integrated with a diverse array of powerful scientific Python libraries. This adaptable scripting environment provides access to advanced data visualization and calculation functionalities which further expand the existing Flare capabilities. This enables users to create customized and automated workflows for their drug discovery projects which integrate seamlessly with the Flare GUI.
References
- RDKit. https://www.rdkit.org/ (accessed 2024-04-16)
- scikit-learn: machine learning in Python — scikit-learn 1.4.2 documentation. https://scikit-learn.org/stable/ (accessed 2024-04-16)
- Maaten, L. van der; Hinton, G. Visualizing Data Using T-SNE. J. Mach. Learning Res 2008, 9 (86), 2579–2605
- Butina, D. Unsupervised Data Base Clustering Based on Daylight’s Fingerprint and Tanimoto Similarity: A Fast and Automated Way To Cluster Small and Large Data Sets. J. Chem. Inf. Comput. Sci. 1999, 39 (4), 747–750. https://doi.org/10.1021/ci9803381
- Michaud-Agrawal, N.; Denning, E. J.; Woolf, T. B.; Beckstein, O. MDAnalysis: A Toolkit for the Analysis of Molecular Dynamics Simulations. Journal of Computational Chemistry 2011, 32 (10), 2319–2327. https://doi.org/10.1002/jcc.21787
- Introduction — PubChemPy 1.0.4 documentation. https://pubchempy.readthedocs.io/en/latest/guide/introduction.html#pubchempy-license (accessed 2024-03-13)


