Improving PROTAC properties via single-point changes to linkers
We explore how computational methods can be applied to proteolysis targeting chimera (PROTAC) design, to effectively tackle some of the ...
News
Lead Finder1 is a protein-ligand docking tool for the virtual screening of molecules and quantitative evaluation of interactions between protein and ligands. In this case study, two different Lead Finder docking modes (standard and extra precision) were used in docking studies on a small number of Factor-Xa (FXa) protein-ligand complexes originally used in the CSAR 2014 benchmark exercise2. Results show the robustness of Lead Finder at finding the bioactive conformation of the ligands, when starting from a random conformation. In addition, it shows that the standard docking mode and the extra-precision mode work well at docking ligands and the later gives tighter dockings and may highlight ligands with lower activity and that do not fit into the active site.
Lead Finder is a docking tool from BioMolTech3 which generates docked ligand poses starting from the 3D structure of a protein (either experimentally derived by X-ray, or modeled by homology) and one or more 3D ligand structures. Lead Finder assumes that the protein is rigid, and analyses the possible conformations of the ligand by rotating functional groups along each freely rotatable bond.
FXa has been the target of drug discovery efforts at many pharmaceutical companies, where structure-based design has been used extensively. For this reason, FXa has been frequently used to benchmark new methodologies in structure-based design.
In this case study, we sought to replicate the typical experiments performed with docking engines during the lead optimization phase of small molecule discovery. We used, and compared, two different Lead Finder docking
modes (standard and extra precision) in two separate experiments. First we carried out self-docking studies on a small number of FXa protein-ligand complexes originally used in the CSAR 2014 benchmark exercise. Secondly we applied the two docking modes to a set of 45 related compounds, again taken from the CSAR 2014 dataset.
The ideal docking process with Lead Finder (Stage 1 in Figure 1) starts with an accurate protein preparation with BioMolTech’s Build Model.4 This includes:
Build Model uses an original graph-theoretical approach5 to assign optimal ionization states of protein residues at arbitrary pH conditions, which is based on the Screened Coulomb Potential (SCP) model.5,6
After completing protein preparation, an energy grid map (Stage 2) is calculated and saved for the protein binding site. This energy map is then used to dock the ligand structures.
The docking engine in Lead Finder (Stage 3) combines a genetic algorithm search with local optimization procedures, which make Lead Finder efficient in coarse sampling of ligands poses and following refinement of promising solutions.
The standard docking mode provides an accurate and exhaustive search algorithm. However, in extra-precision mode, Lead Finder uses the most rigorous sampling and scoring algorithms to increase accuracy and reliability of predictions at the cost of slightly slower speed of processing.
Scoring functions1 in Lead Finder (Stage 4) are based on a semi-empiric molecular mechanical functional that explicitly accounts for various types of molecular interactions. Individual energy contributions are scaled with empiric coefficients to produce three scoring functions tailored for:
In this study we concentrated on the poses that were generated and hence were focused on the Rank-score function.
Initially we used a crystal structure of the FXa protein in complex with compound GCT000006 (GCT, PDB ID: 4ZH8). As can be seen in Figure 2, the 6-chloronapth-2-yl group of GCT binds into the S1 primary specificity pocket, while the morpholino group occupies the aromatic box (Tyr99, Try215, Phe174) of the S4 pocket.
Figure 2. Structure of the FXa protein in complex with the GCT ligand.
The protein was prepared with the default options of Build Model, in which the ligand is removed from the active site and the water molecules are retained. The coordinates of the ligand were then used to define the bounding box for the calculation of the energy grid maps.
We started by re-docking GCT to the 4ZH8 crystal structure to address the ability of Lead Finder of correctly identifying its bioactive conformation. In order to avoid bias in the self-docking experiment, the 3D conformation of GCT was flattened to 2D and then converted back into 3D using Cresset’s XedConvert7. A minimization with Cresset’s XedMin7 was followed to relax the ligand to a local minimum. The GCT ligand was then docked to the protein PDB 4ZH8 using the standard docking mode and the extra-precision docking mode.
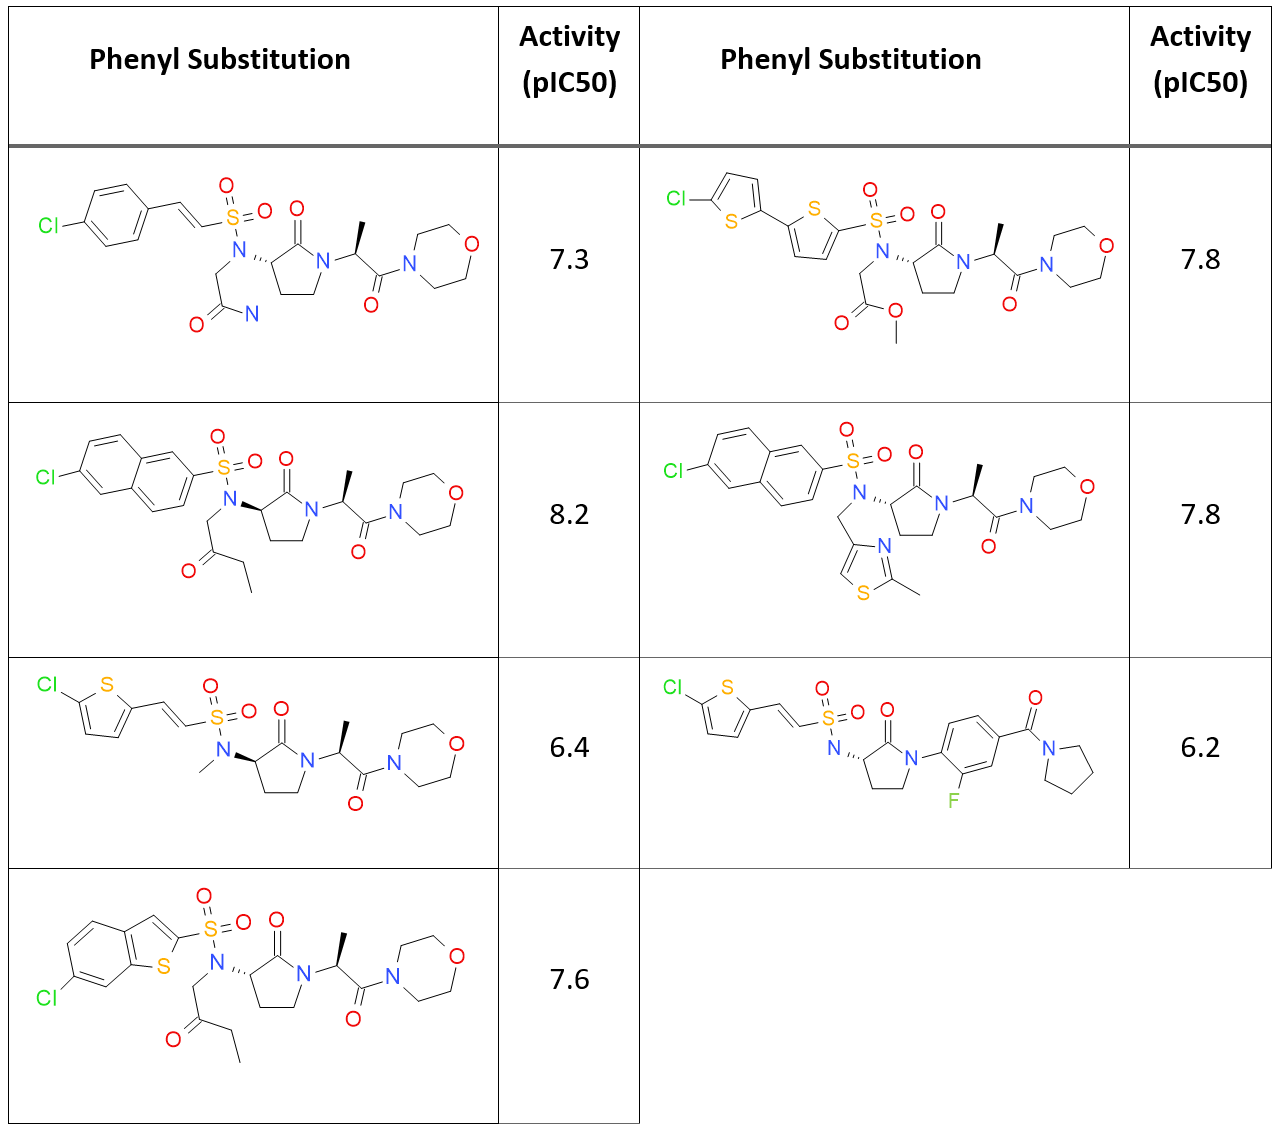
A sub-set of 45 small molecules from the CSAR 2014 dataset with known activity against FXa (Table 1) were docked to the crystal structure 4ZH8.
Most of these ligands have in common a chlorinated mono or polyaromatic group and a morpholino group. All ligands were converted into 2D and then back to 3D with XedConvert and subsequently minimized with XedMin. The crystallographic ligand was used to define the bounding box for the energy grid maps. The 45 ligands were then docked to the protein using the standard docking mode and the extra-precision mode.


When using the standard docking mode and the extra-precision mode, Lead Finder outputs up to 10 best poses (if available) ranked in order of increasing rank score.
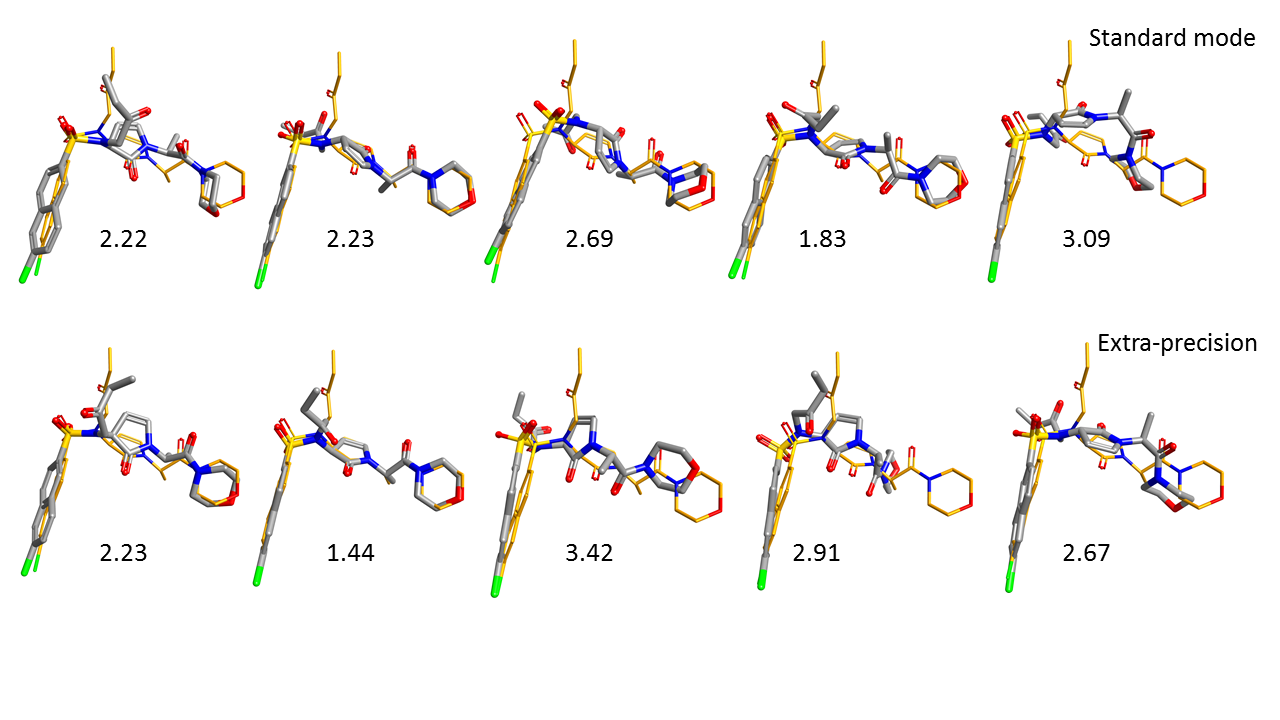
Figure 3 shows the five top ranking poses of GCT obtained using the Lead Finder standard (top row) and extra precision (bottom row) docking modes. The poses are ordered from the best ranking (left) to the worst ranking (right).
As can be seen in this picture, the five top ranking poses for both standard docking mode and extra-precision mode are closely aligned to the X-ray conformation of the ligand, correctly orienting the naphthalene ring of GCT into the S1 binding pocket.
In terms of RMSD deviation, values obtained are similar with the two different modes with each method able to find a solution within 2A RMSD of the x-ray pose in the top 5 results. However, the extra precision mode finds this result at position 2 rather than 4 and the pose is very close to the xray-ligand (RMSD 1.44) with a single R-group oriented differently. A small but potentially significant improvement.
Figure 4 shows the self-docking of other FXa proteins (4ZHA, 4Y7A and 4Y79) performed with the standard docking mode and with the extra-precision mode.
For these less flexible ligands, the extra-precision mode seems to have little effect on the RMSD of the results. Both modes are again able to identify the correct orientation of the ligand in the FXa active site with a RMSD that is within 2A for the top scoring pose..
Figure 5 shows a side-by-side comparison of the superimposed top-ranking poses for the 45 FXa ligands docked into the 4ZH8 protein using standard (left) and extra precision (right) docking modes.
For the standard mode, the majority of ligands are docked with the naphthalene ring correctly pointing down into the S1 binding site. However, one ligand is not docked as expected, with the pyrrolidine group pointing to the outside of the protein (GCT98A). Interestingly, this compound is the one with the lowest activity (pIC50 6.2) in the dataset.
When using the extra-precision mode, the docked poses in general look tidier, even though two ligands docked with the naphthalene group pointing outside of the S1 pocket: one is again GCT98A, and the other is GCT44A, the compound in the dataset with the second lowest activity (pIC50 = 6.4). These findings seem to indicate that Lead Finder may be able to provide useful suggestions for discriminating between active and non-active compounds.
This case study shows a typical Lead Finder docking workflow and demonstrates the robustness of the program by means of several self-docking experiments. Results show that Lead Finder does a good job at finding the bioactive conformation of flexible ligands, when started from a random conformation. In addition, we explored two docking modes (the standard and extra-
precision) to dock a sub-set of FXa ligands from CSAR 2014. While both methods seem to work well at generating sensibly aligned poses, the extra-precision mode provides tighter dockings and may be able to highlight ligands with lower activity which may not fit into the active site.