Improving PROTAC properties via single-point changes to linkers
We explore how computational methods can be applied to proteolysis targeting chimera (PROTAC) design, to effectively tackle some of the ...
News
Free Energy Perturbation (FEP) calculations enable us to predict the change in the binding free energy of molecules that differ from each other by means of simple structural modifications. These predictions are invaluable in drug discovery, as they guide experimental efforts, so precision in the predictions is key. However, one challenge in FEP is dealing with varying levels of precision in different molecular transformations. In this article, we will explore the subgraph analysis feature of Flare™ FEP, a sophisticated post-processing tool aimed at improving the accuracy of the FEP predictions by focusing on specific subsets of ligands.
One common issue faced in FEP calculations is the heterogeneity of prediction accuracy. Cresset’s error analysis workflow combines all of the multiple sources of error (statistical errors from MBAR, hysteresis estimates from two-way links, and cycle closure errors from the graph network analysis) together into a single error estimate for each ΔG value. However, in some circumstances, this can be misleading. In particular, if the graph contains two clusters (subgraphs) of molecules where the similarity is high within each cluster but the links between the clusters are noisy or of poor quality, we can end up in a situation where the relative activities within each cluster can be predicted with confidence, but the activity difference between the clusters has a very large associated error. This is difficult to convey in a single error estimate for each molecule. Subgraph analysis is a technique used to identify and address variations in prediction precision within a Flare FEP project. It involves breaking down the FEP network into smaller clusters, or subgraphs. The idea is to recompute the ΔG and the ΔG error of each subgraph so that problematic predictions are isolated within the subgraph and do not affect the results for the molecules in the other subgraphs.
At the end of the benchmarking FEP calculation, the subgraph analysis is run automatically. The results can be viewed as new activity plots, that contain only data points for the molecules of each cluster and show the recalculated statistics for each cluster of molecules. They can be accessed with the help of a drop-down menu at the activity plot window of the Flare FEP project that allows you to choose individual clusters for inspection.
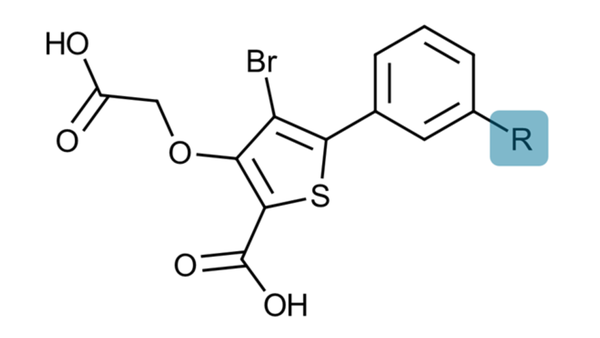
To illustrate the concept of subgraph analysis, consider an FEP benchmarking run involving the Protein Tyrosine Phosphatase 1B (PTP1B) target and a series of congeneric ligands, whose common substructure is shown in Figure 1. PTP1B is a well-studied enzyme that plays a crucial role in cellular signal transduction. It is primarily involved in the dephosphorylation of tyrosine residues on proteins. PTP1B has been extensively investigated for its implications in various diseases, particularly diabetes, and obesity, making it a promising target for drug development and therapeutic interventions.1
Figure 1: The substructure of the congeneric series used for this FEP experiment. The R-group is where the structural modifications for the FEP experiment are introduced.
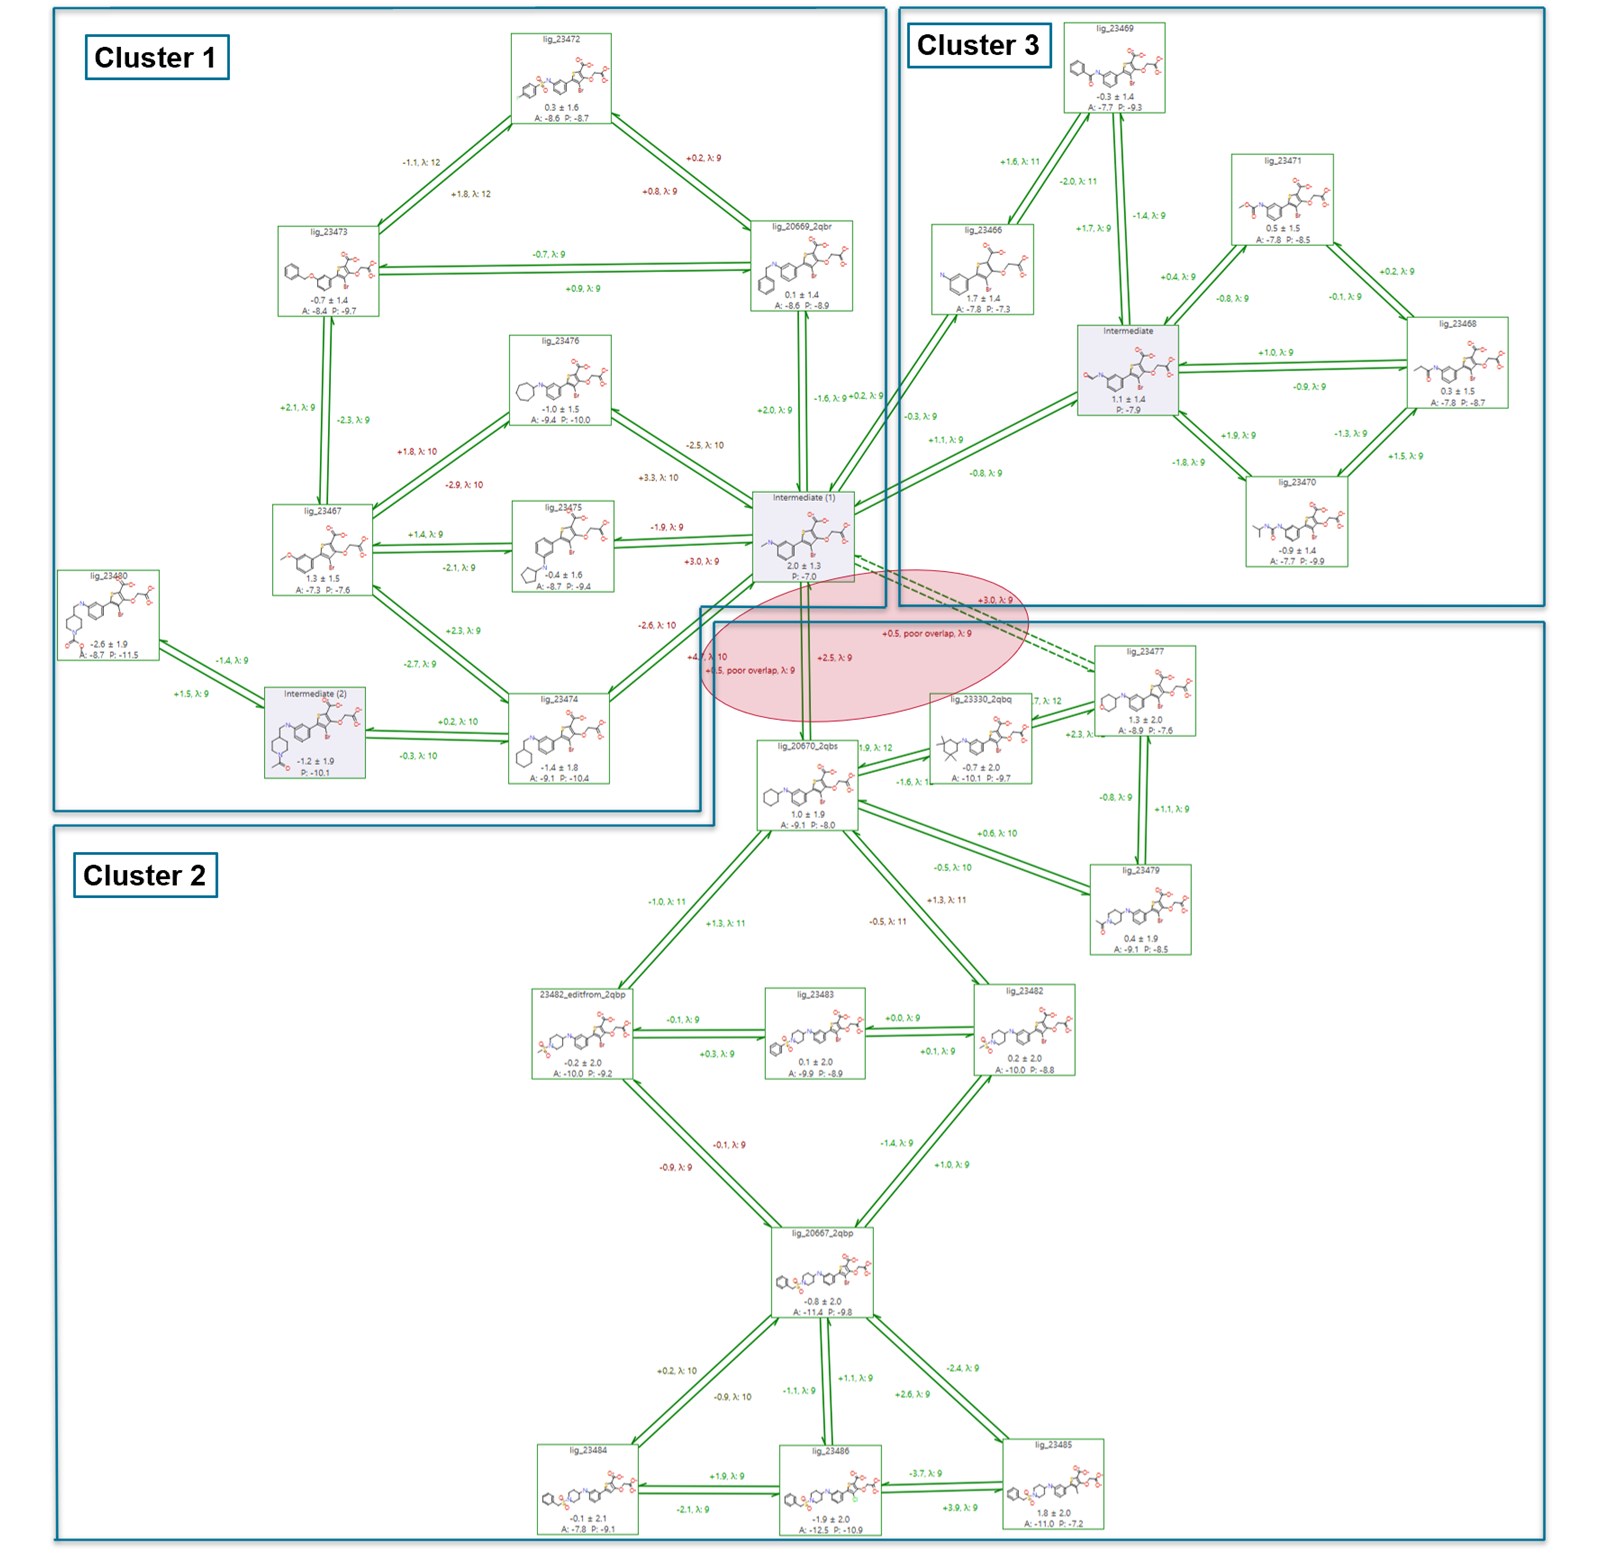
At the end of the PTP1B benchmarking experiment, subgraph analysis identifies three distinct clusters of ligands, which are shown with the help of the FEP graph in Figure 2.
Cluster 3 includes molecules with binding free energy predictions close to the experimental values (R2 = 0.82, MUE = 0.70 kcal/mol). Clusters 1 and 2 are of particular interest because they are connected through two links of poor quality characterized by high hysteresis and bad overlap.

Figure 2: The FEP graph after the benchmarking calculation shows that three clusters are identified by the subgraph analysis algorithm. Clusters 1 and 2 are connected by two links of poor quality (highlighted in red).
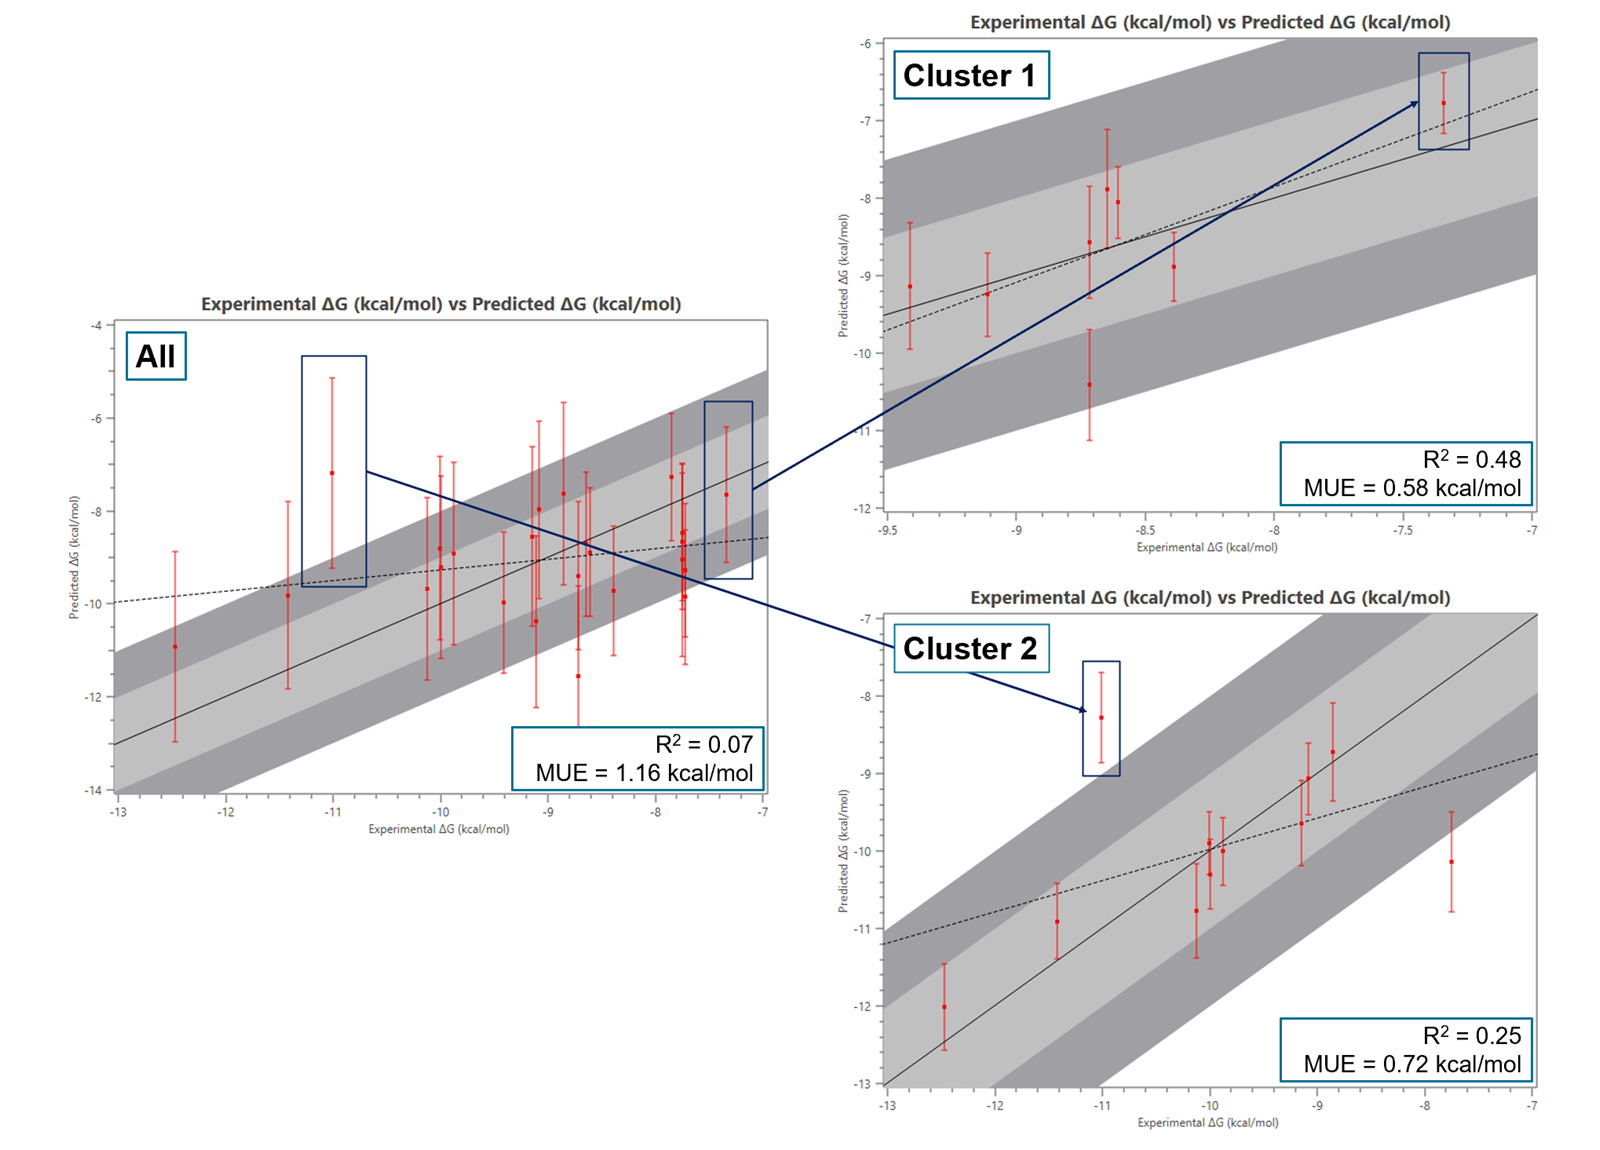
If the graph is considered in its entirety and all predictions are retained in the calculation of the binding free energy (ΔG) and of the corresponding errors, the inaccuracies in the connecting links (affected by high hysteresis) propagate errors to all molecules: this typically results in artificially high error bars for all predictions (Figure 3 – left).
By fragmenting the whole graph of molecules into distinct clusters, subgraph analysis instead prevents the two suboptimal links (characterized by high hysteresis and accordingly poor quality of predictions) from affecting those producing more accurate results. This segmentation contributes to better overall statistical outcomes and underscores the significance of subgraph analysis in refining FEP predictions.
Both cluster 1 and cluster 2 when analyzed separately, exhibit significantly lower errors as shown in the corresponding activity plots (Figure 3 - right).

Figure 3: Activity plots (experimental vs predicted ΔG) for all the molecules before the sub-cluster analysis (left) and for Clusters 1 and 2 (right).
At the same time, the recalculation of the binding free energy (ΔG) has yielded improved R² and Mean Unsigned Error (MUE) values within the individual subgraphs. More specifically the correlation coefficient R2 was increased from 0.07 to 0.48 for cluster 1 and 0.25 for cluster 2, whereas the MUE was decreased from 1.16 kcal/mol to 0.58 and 0.72 kcal/mol for cluster 1 and cluster 2 respectively.
Subgraph analysis is a valuable method, enabling an in-depth understanding of the results of FEP calculations. By dissecting a complex graph of molecules into distinct clusters, the method effectively isolates problematic connections and identifies groups of compounds with lower internal error statistics. This dissection reduces the impact of errors propagated through the graph and typically leads to a more realistic assessment of prediction errors as well as improved R2 and MUEs for individual subgraphs. This feature enhances the precision and reliability of FEP calculations within the same cluster, contributing to a broader applicability of Flare FEP in computational drug discovery and molecular design.
Make the right ligand design choices and enable lead optimization with confidence – request an evaluation and try Flare FEP on your project today. During evaluation, you’ll have the chance to put subgraph analysis and Flare FEP’s full range of unique features to the test, while having the freedom to publish any results produced and use these for further research.
1. Tonks, N. K. PTP1B: From the Sidelines to the Front Lines! FEBS Letters 2003, 546 (1), 140–148. https://doi.org/10.1016/s0014-5793(03)00603-3.