Improving PROTAC properties via single-point changes to linkers
We explore how computational methods can be applied to proteolysis targeting chimera (PROTAC) design, to effectively tackle some of the ...
News
One of the main challenges in drug discovery projects is identifying molecules with an appropriate balance of multiple properties. Radial plots are an intuitive visual tool to summarize multiple numerical data into a single picture, calculating a multi-parameter score to help you select the molecules with the best fit to the ideal property profile for your project. Radial plots are available in:
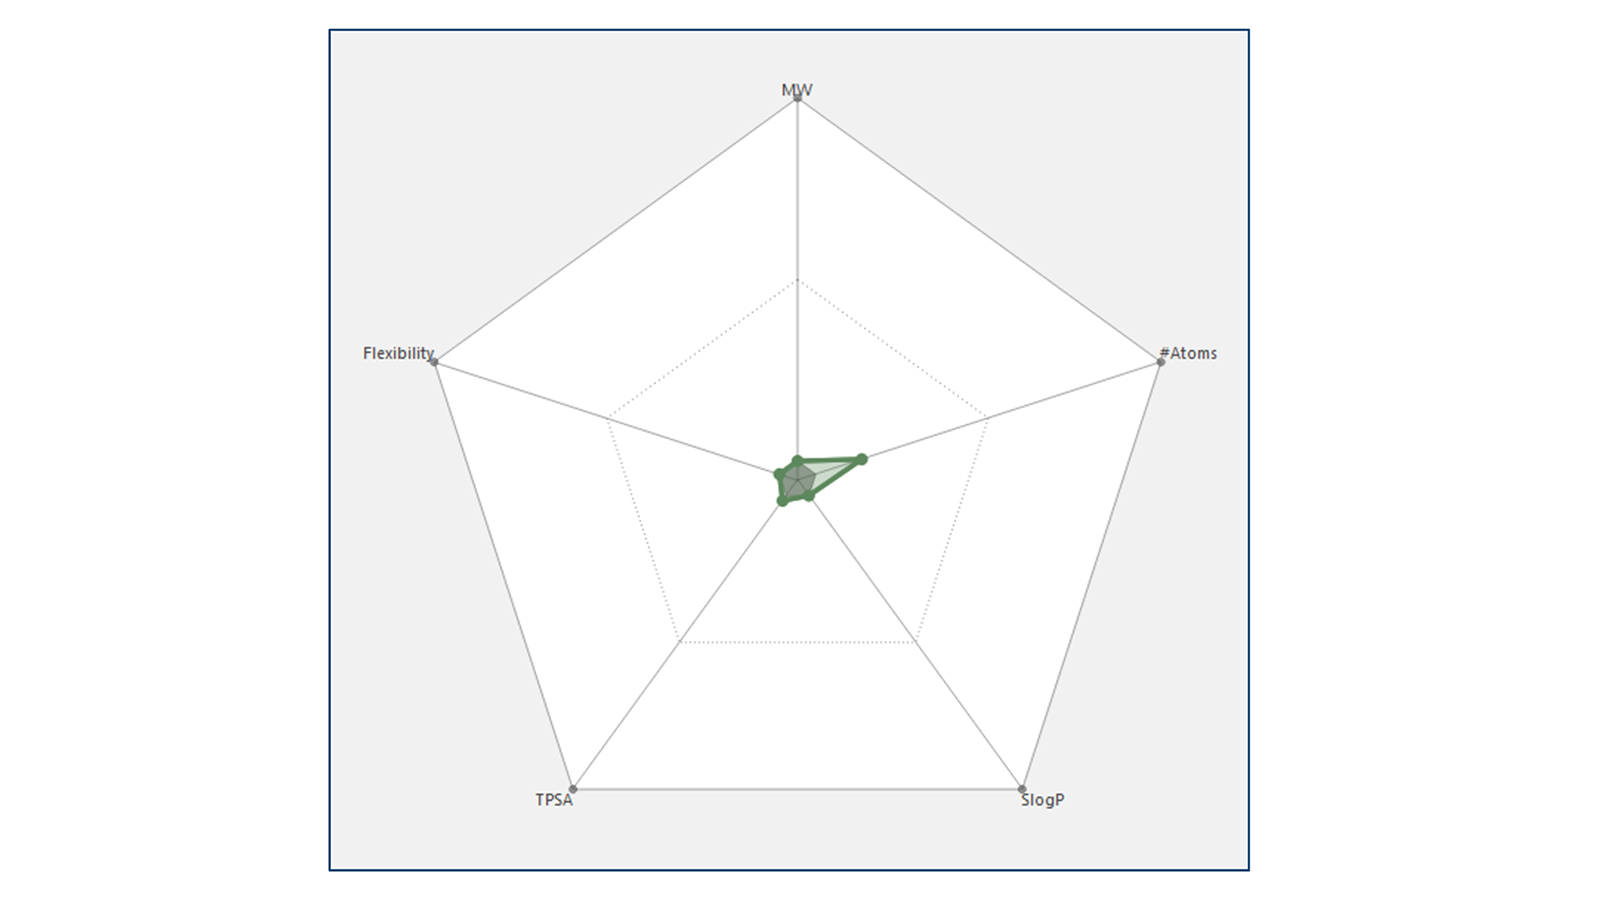
For a single molecule, radial plots in the Ligands table and in the Radial Plot window (Figure 1) can plot multiple numerical properties for that molecule using data that is present in the Ligands table. These may include for example activity and physico-chemical properties such as molecular weight (MW), topological surface area (TPSA), lipophilicity (SlogP).

Figure 1. Radial plot for a single molecule shown in green.
Radials plot are based on the idea that molecule properties that are 'perfect' should be displayed at the center of the radial plot. Thus, a molecule with near-perfect properties should have a radial plot with a small, encapsulated area (shown in green in Figure 1 and Figure 2 - left). Conversely, poor properties would be plotted at the edge of the radial plot such that a molecule with sub-ideal properties would have a large, enclosed area (as shown in Figure 2- right). Hovering the mouse over any data point gives information about that point in a tooltip.
 Figure 2: Different plot properties are combined into a single radial plot score (top-left) which represents the fit of a particular compound to the overall project properties.
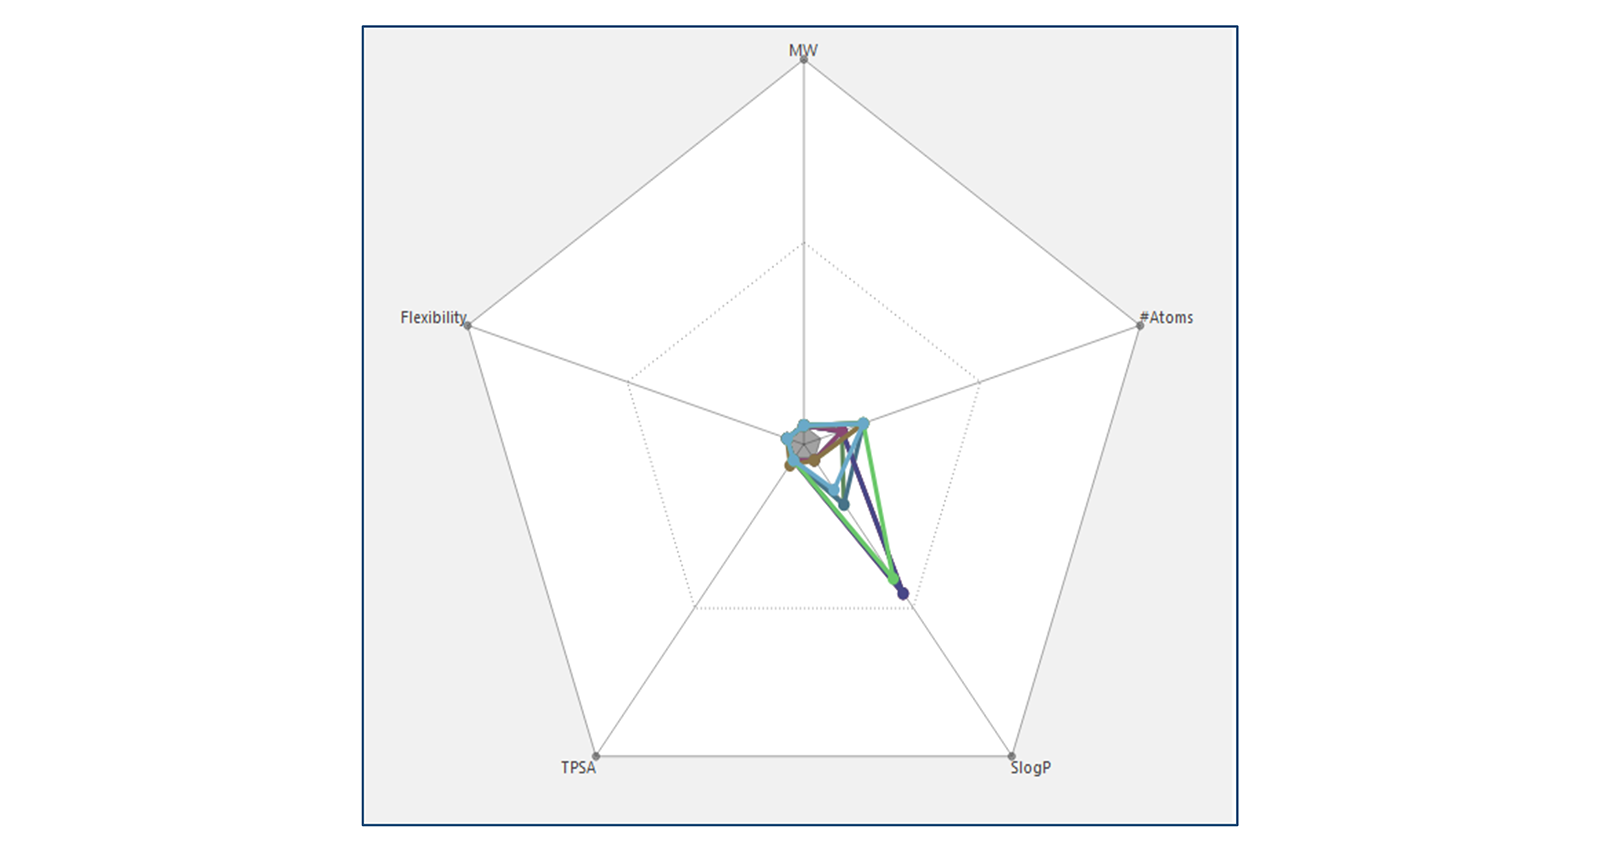
Selecting multiple molecules/alignments causes multiple radial plots to be displayed with a different color used for each molecule (Figure 3).
 Figure 3: Radial plot of multiple molecules shown with different colors.
In Flare and Spark, radial plot properties are combined into a single radial plot score (RPS) that represents the fit of a compound to the ideal properties profile for the project (Figure 2). In combining plot properties, a weight is applied to each individual property and used to set its importance with respect to the overall project profile. For example, if the project is prepared to accept lower activity in return for a better TPSA profile, then the weight of the 'Activity' property could be reduced below 1.0 (the default weight) while the weight of the TPSA property could be set above 1.0.
In this way, you can create a customized RPS for your project. For example, you can develop an RPS for ‘drug-like’ physico-chemical properties based on the Lipinski rule of 51 and Veber rules2. For earlier-stage projects, you could have a RPS based on ‘lead-like’ properties for filtering compounds listed in chemical supplier catalogs before carrying out any small-scale virtual screening of these compounds against the target, thereby saving computational resources.
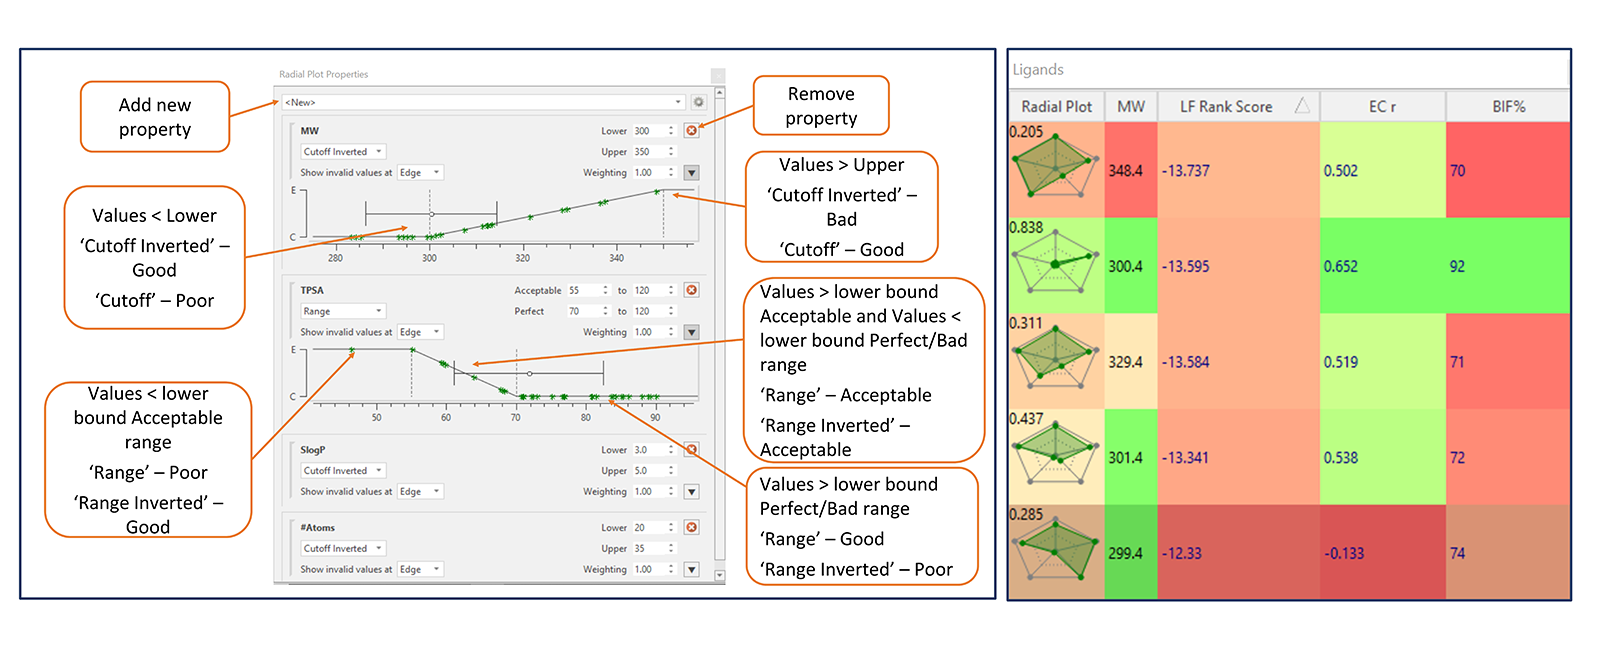
In Flare and Spark, five properties are displayed in radial plots by default (MW, #Atoms, SlogP, TPSA, Flexibility) with equal weighting, together with biological activity when available. Other numerical properties (such as Docking scores and Electrostatic Complementarity™ (EC) scores) can be added to the radial plot by including them in the Radial Plot Property window (Figure 4 – left). This window sets up the display of the radial plot and the weighting that is used for combining properties into the RPS.
The values from each numerical property can be plotted using four different functions to represent good and poor values (Figure 4 – left). The ‘Cutoff’ and ‘Cutoff Inverted’ functions are used for properties which have simple linear scale functions. The ‘Cutoff’ function is generally used for properties where higher values numbers are better (such as activity or EC scores), whereas ‘Cutoff Inverted’ function is used for properties where smaller numbers are better (such as MW and SlogP). ‘Range’ and ‘Range Inverted’ functions are used for properties which have an acceptable range of values (such as TPSA) and a range needs to be defined for this property.
Radial plots in the Ligands table can be colored according to RPS (Figure 4 – right). By default, radial plots with an overall RPS of 0 (unacceptable) are colored in red, those with an overall RPS of 0.5 (acceptable) are colored in yellow, and those with overall RPS of 1 (perfect) are colored in green. Property columns can also be colored, based on how each value fits the profile set in the Radial Plot Properties window.
Coloring the radial plots and property columns facilitates the identification and prioritization of molecules with the optimal fit to the ideal radial plot profile defined for the project.
Figure 4: Left: Radial Plot Properties window displaying various functions for representing good and poor values of various properties of molecules. Right: Columns in the Ligands table are colored according to the fit of each value to the radial plot profile for that property, while radial plots are colored according to RPS (right).
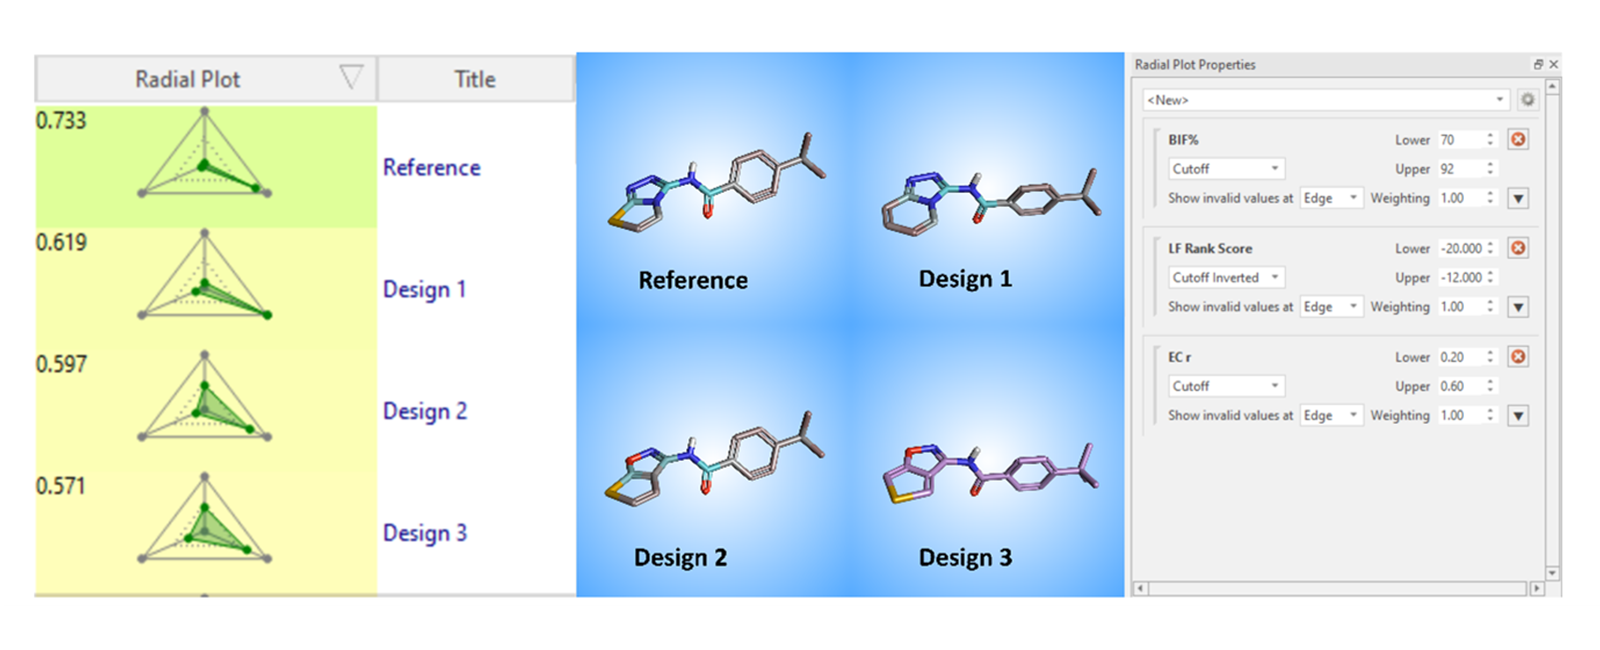
In this example, radial plots have been used to prioritize molecules that potentially bind to Tankyrase, a member of the PARP (poly (ADP-ribose) polymerase) family of enzymes, which is a therapeutic target for cancer.3 Molecules were designed using Cresset bioisosteric replacement program, Spark. Designs with the best bioisostere similarity score (BIF%) were then imported into Flare and further scored using Docking and EC. The Spark results were then prioritized by setting up a customized RPS which consisted of the Docking score, the EC score, and the BIF%. To set up the new score, the default radial plot properties were deleted, and the new properties were added using the Radial Plot Properties window shown in Figure 4. The ‘lower bound’ and ‘upper bound’ values of the three properties were judiciously selected based on the calculated values for the docked crystallographic ligand, and the molecules were prioritized and sorted by decreasing RPS. The top-scoring molecules can now be used to develop new designs of potential inhibitors against Tankyrase, as shown in Figure 5.
 Figure 5: Prioritizing molecules that can potentially bind to Tankyrase using Radial Plot function in Flare and Spark.
Prioritize the molecules with the optimal balance of properties by using radial plots in Flare and Spark to overcome the challenges of multi-parameter optimization.
Request an evaluation of Flare and Spark.