Improving PROTAC properties via single-point changes to linkers
We explore how computational methods can be applied to proteolysis targeting chimera (PROTAC) design, to effectively tackle some of the ...
News
New versions of Forge and Torch are due next month. V10.4 is packed with new science and over 30 new or improved features that significantly enhance both applications. Here I reveal a few of the new features in Forge and Torch that I am sure will prove very popular.
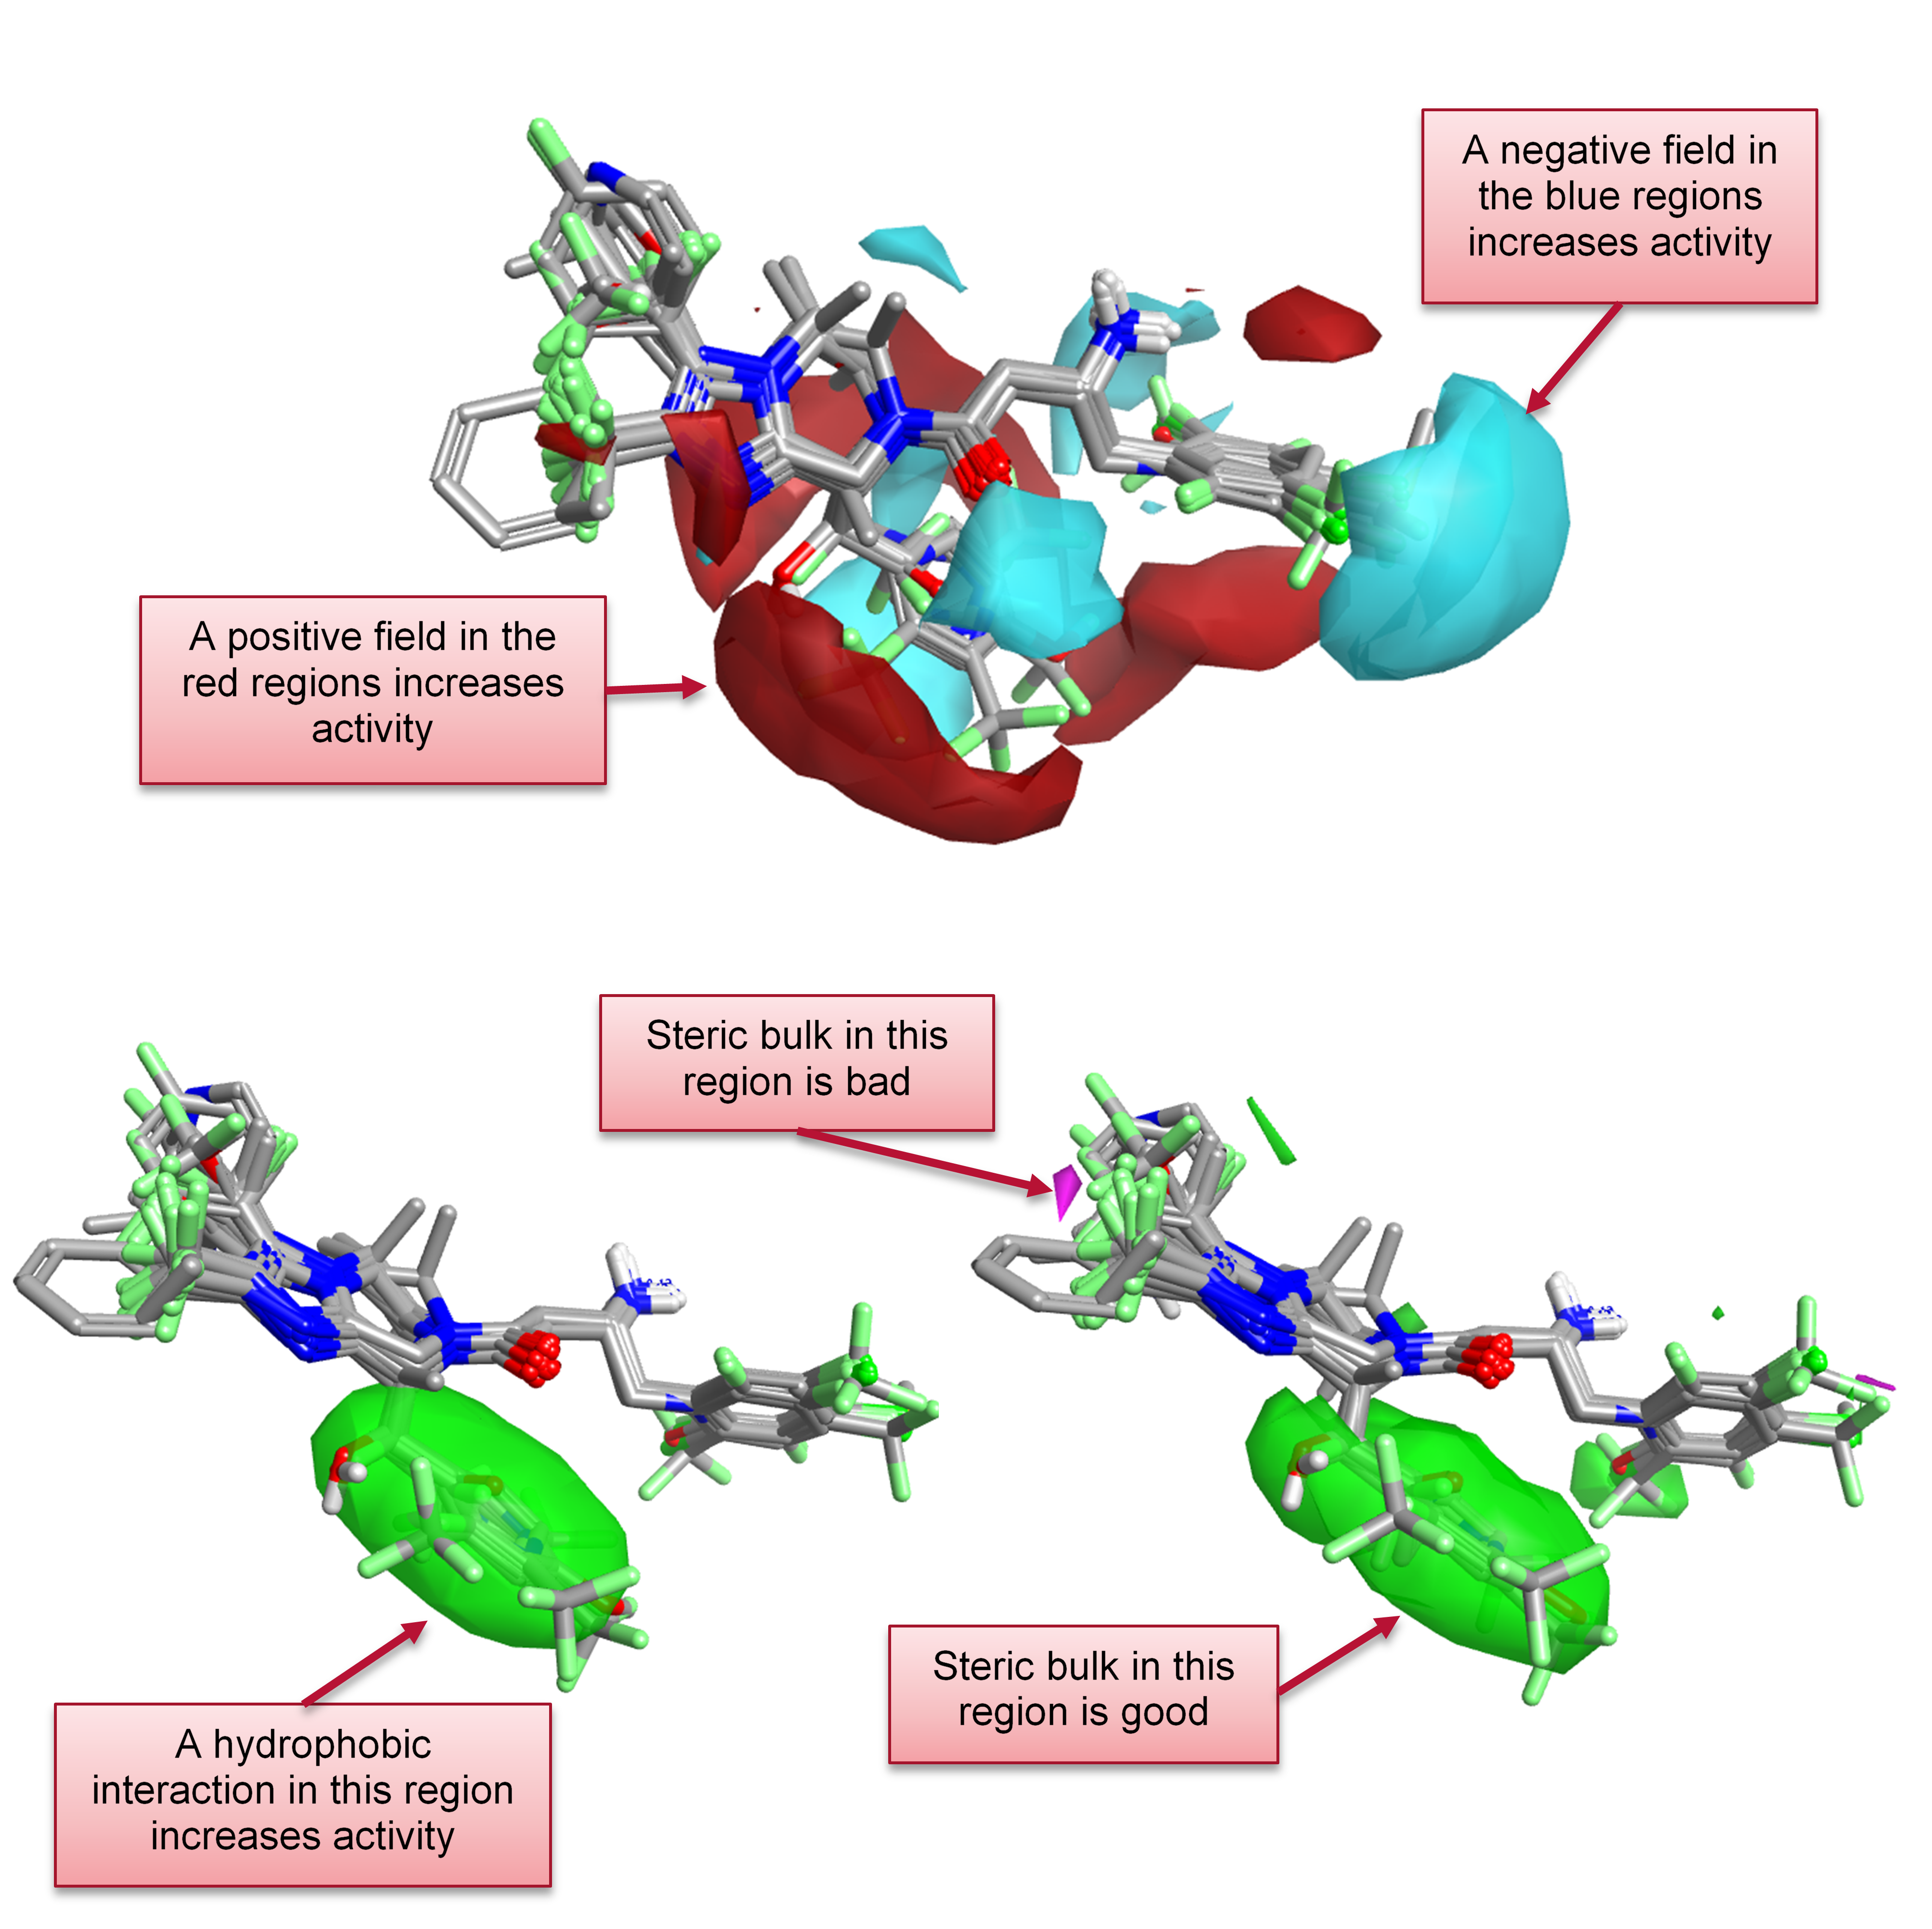
Building on research done in collaboration with customers we will be introducing a new component in Forge V10.4 – Activity Atlas. This summarizes all the SAR for a series in a 3D model that can be used to inform new molecule design. Activity Atlas will particularly benefit project teams where there is not enough SAR for a traditional 3D-QSAR approach. It gives a range of information including:
This last set of maps are derived from the Activity Miner module, summarizing the activity cliff data across the series into a simple map of the critical points in the SAR. The example below is an Activity Atlas map of the activity cliff data for DPP-IV.

The introduction of Activity Atlas models has led to model handling in Forge being radically overhauled. With this release you now have a simple drop down box for choosing which model you wish to use or display. This makes it easy to compare models built against different targets or using different methods (3D-QSAR, Activity Atlas or k-Nearest Neighbors). You can now build a number of models for a target and use only the one with the best performance or quickly switch between models against different activities. Additionally, all the model building information windows have been rolled together into a single widget to significantly enhance the information flow when working with models and reduce GUI clutter while performing other tasks.
For more detail, see Mark Mackey’s, recent blog Activity Atlas – summarize your SAR in 3D.
The Storyboard window is another new feature to be introduced in Forge V10.4. Storyboard records ‘scenes’ from the 3D window that can be recalled with a click. All details of the 3D window will be recorded, for example:
The intention is to enable communication of a project to colleagues through recording of a story consisting of several scenes. However, the window is also useful for recording important results, or for analyzing different models, such as those built against different activities.

The release of Forge is close. Contact us for further information on Activity Atlas and the Storyboard.
Torch V10.4 sees the enhancement of multi-parameter optimization capabilities, such as:
The radial plots, introduced in V10.3, provide a simple way to summarize numerical data. You can now color this data based on the profile that you create for the radial plot. The colored radial plots can be sorted so you can identify, at a glance, the structures which more closely reflect the ideal compound profile. This makes radial plots a powerful tool for multi-parameter optimization.
One of the most requested features by customers is the ability to include corporate or externally-computed data for any compound into the molecule table. For example, some customers would like to apply their own pKa calculation to any newly designed compound. In Torch V10.4 it will be possible to import external data/properties as additional project columns in a seamless manner from a web service running the appropriate property calculator. These can then be included in the radial plots or in the multi-parameter optimization sorting.
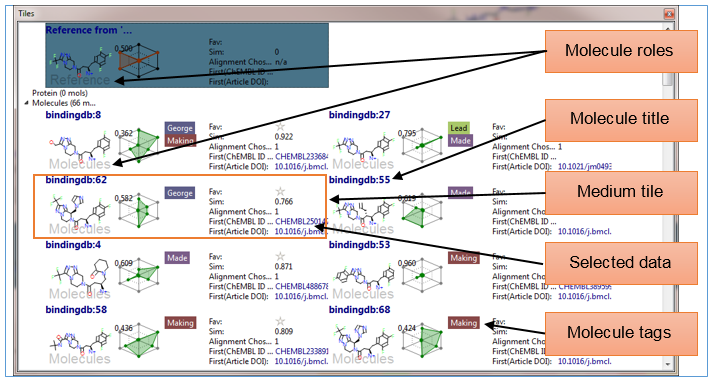
In the release of Spark V10.3 we introduced the Tile view as an alternative to the traditional molecular spreadsheet. In this release this view is now available in Torch. The Tile View provides a simple summary of the information that is important to you and presents this in a compact and visually appealing format.

Other features in the release of Torch V10.4 include:
The release of Torch V10.4 is close. Contact us for further information on this release.