Improving PROTAC properties via single-point changes to linkers
We explore how computational methods can be applied to proteolysis targeting chimera (PROTAC) design, to effectively tackle some of the ...
News
Activity Atlas1 is a new component available in Forge2, Cresset’s powerful workbench for ligand design and SAR analysis. Activity Atlas models summarize the SAR for a series into a visual 3D model that informs design decisions and helps prioritize molecules for synthesis. This new method is particularly useful for project teams where there is not enough SAR for a traditional 3D-QSAR approach. In this case study, Activity Atlas was used to analyze the SAR of a series of adenosine A1, adenosine A2a and adenosine A3 antagonists, with the objective to investigate and understand the electrostatic, hydrophobic and shape features underlying receptor selectivity.
Activity Atlas is a probabilistic method of analyzing the Structure-Activity Relationships of a set of aligned compounds as a function of their electrostatic, hydrophobic and shape properties. The method uses a Bayesian approach to take a global view of the data in a qualitative manner. Results are displayed using Forge visualization capabilities to gain a better understanding of the features which underlie the SAR of your set of compounds.
Activity Atlas calculates and displays as 3D visualizations the:
In this case study, the activity cliff summary method in Activity Atlas was used to analyze the SAR of a series of published3 adenosine A1, adenosine A2a and adenosine A3 antagonists, with the objective of understanding the electrostatic, hydrophobic and shape features underlying A2a over A1 and A2a over A3 selectivity.
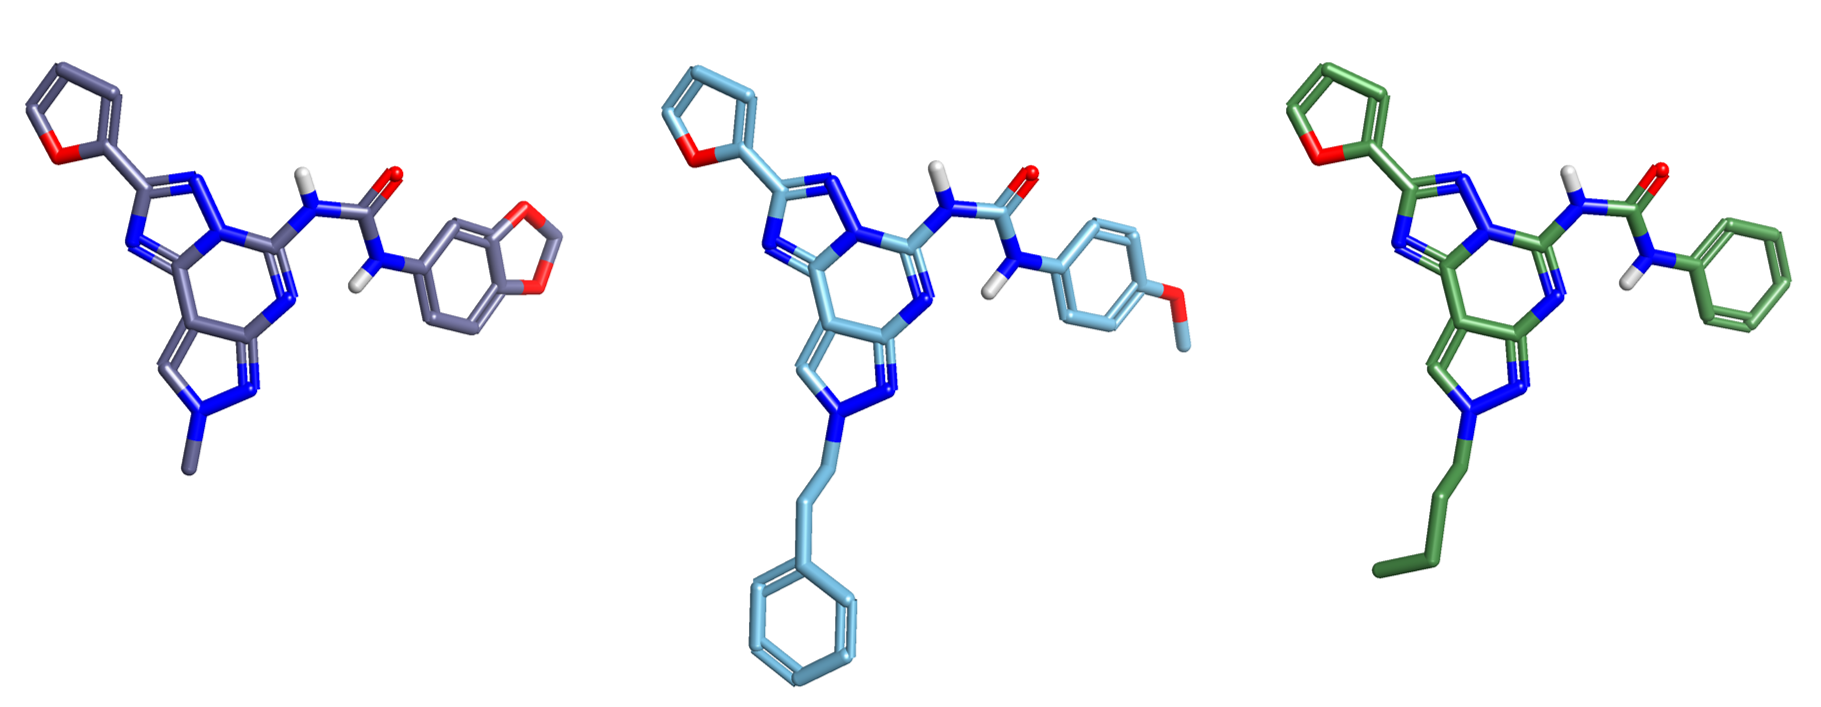
The data set of 342 compounds originally published by Dimova and Bajorath3 was downloaded from the supplementary material together with their adenosine A1, A2a and A3 receptors potency values. A subset of 102 tricyclic compounds (see Figure 1) was selected for the Activity Atlas analysis.
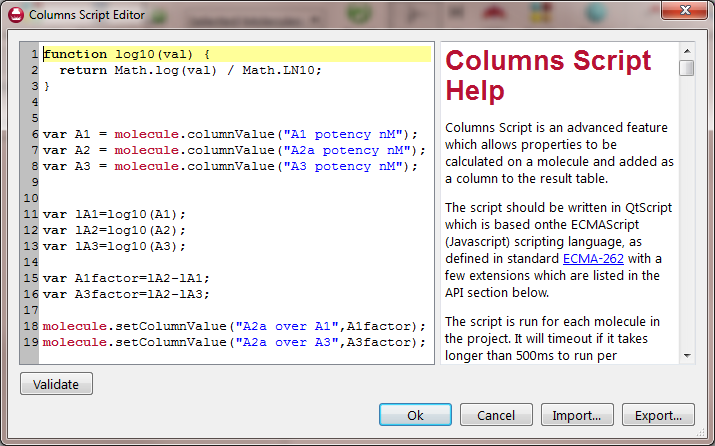
The Column Script Editor in Forge was used to calculate selectivity. The Editor uses a JavaScript syntax to operate in a simple, programmatic way on key properties of the molecules (like the atoms) and on the column data of the project (see Figure 2). Selectivity was calculated as follows:
Cmpd321, Cmpd296 and Cmpd249 (see Figure 1) were chosen as the reference structures to drive the alignment of the full training set of 102 compounds.
A conformation hunt was carried out for Cmpd321 within Forge: an extended low energy conformation was chosen as the initial reference structure to which Cmpd296 and Cmpd249 were aligned by Maximum Common Substructure.
The 102 compounds in the training set were then aligned to the three reference compounds in Figure 1 by Maximum Common Substructure using a ‘very accurate but slow’ set-up for the conformation hunt:
The use of a 3D similarity metric in Activity Atlas requires (as with 3D-QSAR) the generation of alignments for all compounds and is sensitive to misalignment and alignment noise. For this reason, visual inspection of alignments is always recommended, to ensure that there are no anomalies present. Where the calculated alignment is sub-optimal, manual intervention can be used to improve it. In this case study, the alignment of a few compounds was manually adjusted by flipping the phenyl ring on the phenyl-urea side chain (see Figure 1), to align the ortho and meta substituents in a consistent manner across the whole dataset.
Activity Atlas models are calculated following a probabilistic approach which takes into account the probability that a molecule is correctly aligned, as shown in Figure 3 below, rather than assuming that the top scoring or the selected preferred alignment is the correct alignment.
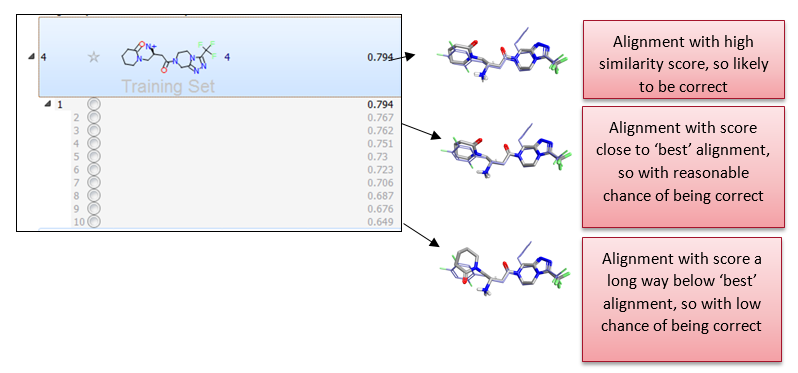
This is done by associating a weight with each alignment based on its similarity score. Alignments with similarity higher than a certain threshold (which can either be automatically calculated by Forge, or manually defined by the user) are fully trusted. Alignments with similarity lower than the low similarity threshold are not trusted and discarded. Linear scaling is applied to associate a proper weight to alignments which have an intermediate similarity score.
Likewise, a weight is also associated with each molecule based on its activity. Molecules whose activity is higher than a certain threshold (which again can either be automatically calculated by Forge, or manually defined by the user) are considered fully active. Molecules whose activity is lower than the low activity threshold are considered inactive. Molecules with intermediate activity are considered only partially active.
Each run of Activity Atlas actually performs three types of analysis: average of actives, activity cliff summary and regions explored analysis, which are briefly summarized below.
This analysis helps you pinpoint the critical regions of SAR, providing a visual 3D summary of the activity cliffs for the data set derived from the Activity Miner4 module.
To do this, a 3D lattice of grid points is created, covering the entire volume of the aligned molecules in the data set, and for each grid point and each pair of molecules, a coefficient is calculated as follows:
Where:
This calculation is repeated for all field types at each grid node.
This model shows how the average active molecule looks like, by analyzing what the active molecules in the data set have in common.
To this end, for each grid point of the 3D lattice created over all aligned molecules, and for each molecule, a coefficient is calculated as follows:
Where:
This calculation is repeated for all field types at each grid node.
The third and final Activity Atlas model is similar to the average of actives analysis, but disregards biological activity completely. Its objective is to make an assessment of what regions of the aligned molecules have been fully explored.
The method works by calculating the field value at each grid point of the 3D lattice. If more than 10 molecules (this number can be defined by the user) have a field value greater than 5 in a certain grid point position, that position is considered fully explored.
The region explored analysis in Activity Atlas can be used to compute a novelty score for each compound in the data set, as well as for newly designed compounds.
The results of the activity cliff summary selectivity analysis for the data set of 102 adenosine A2a, A1 and A3 antagonists are shown as 3D maps in Figure 4.
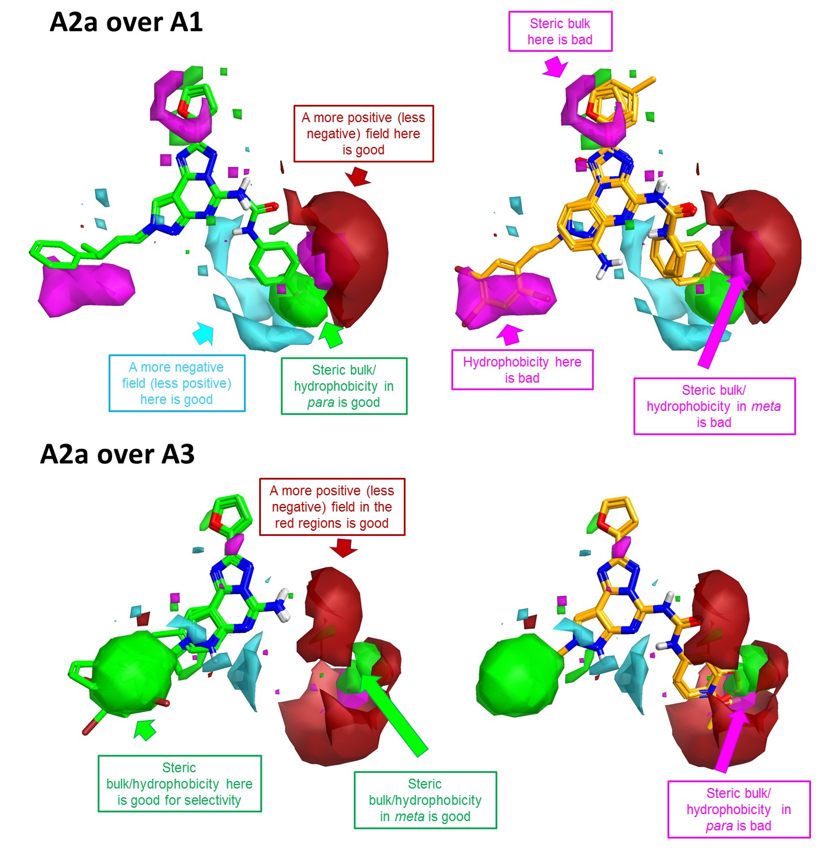
These 3D visualizations provide clear indications about the electrostatic, hydrophobic and shape features underlying A2a selectivity.
To improve A2a over A1 selectivity (Figure 4 –top), you can work on the decoration pattern of the phenyl ring on the right hand side: steric bulk/ hydrophobicity in the para position will be beneficial for selectivity, while steric bulk/ hydrophobicity in meta will be detrimental. Also, substituents which generate a more positive (or less negative) field in proximity of the meta position will be beneficial for selectivity.
As for A2a over A3 selectivity, the most selective compounds are those (shown in green in Figure 4 – bottom) carrying a fused amino-pyrimidine moiety, as clearly shown by the large positive area right in front of the –NH2, while the compounds carrying a phenyl-urea or phenyl-amide side chain (in orange in Figure 4 – bottom) are in general more selective towards A3. For these substituted compounds, steric bulk in the para position of the phenyl ring is anyway detrimental to ‘A2a over A3’ selectivity, while steric bulk/ hydrophobicity in the meta position is beneficial.
As for the left hand side of the molecule, bulky hydrophobic groups are detrimental for A2a over A1 selectivity, but are instead beneficial for A2a over A3 selectivity.
Figures 5, 6 and 7 enter into the details of the selectivity SAR by means of activity view maps calculated and displayed with Activity Miner, a module within Torch5 and Forge providing rapid navigation of complex SAR.
Figure 5 shows the effect on A2a over A1 selectivity of modulating the ring substituents on the phenyl-urea side chain. The para-Me substituted Cmpd18 (in the middle) is one of the most selective compounds in the training set. In agreement with the activity cliff summary maps, it can be seen that replacing the methyl group in para with bulky, hydrophobic substituents such as Br, OMe, CF3 is in general well tolerated, while substituents in meta (such as for example Cl, OMe) have in general a detrimental effect on selectivity.
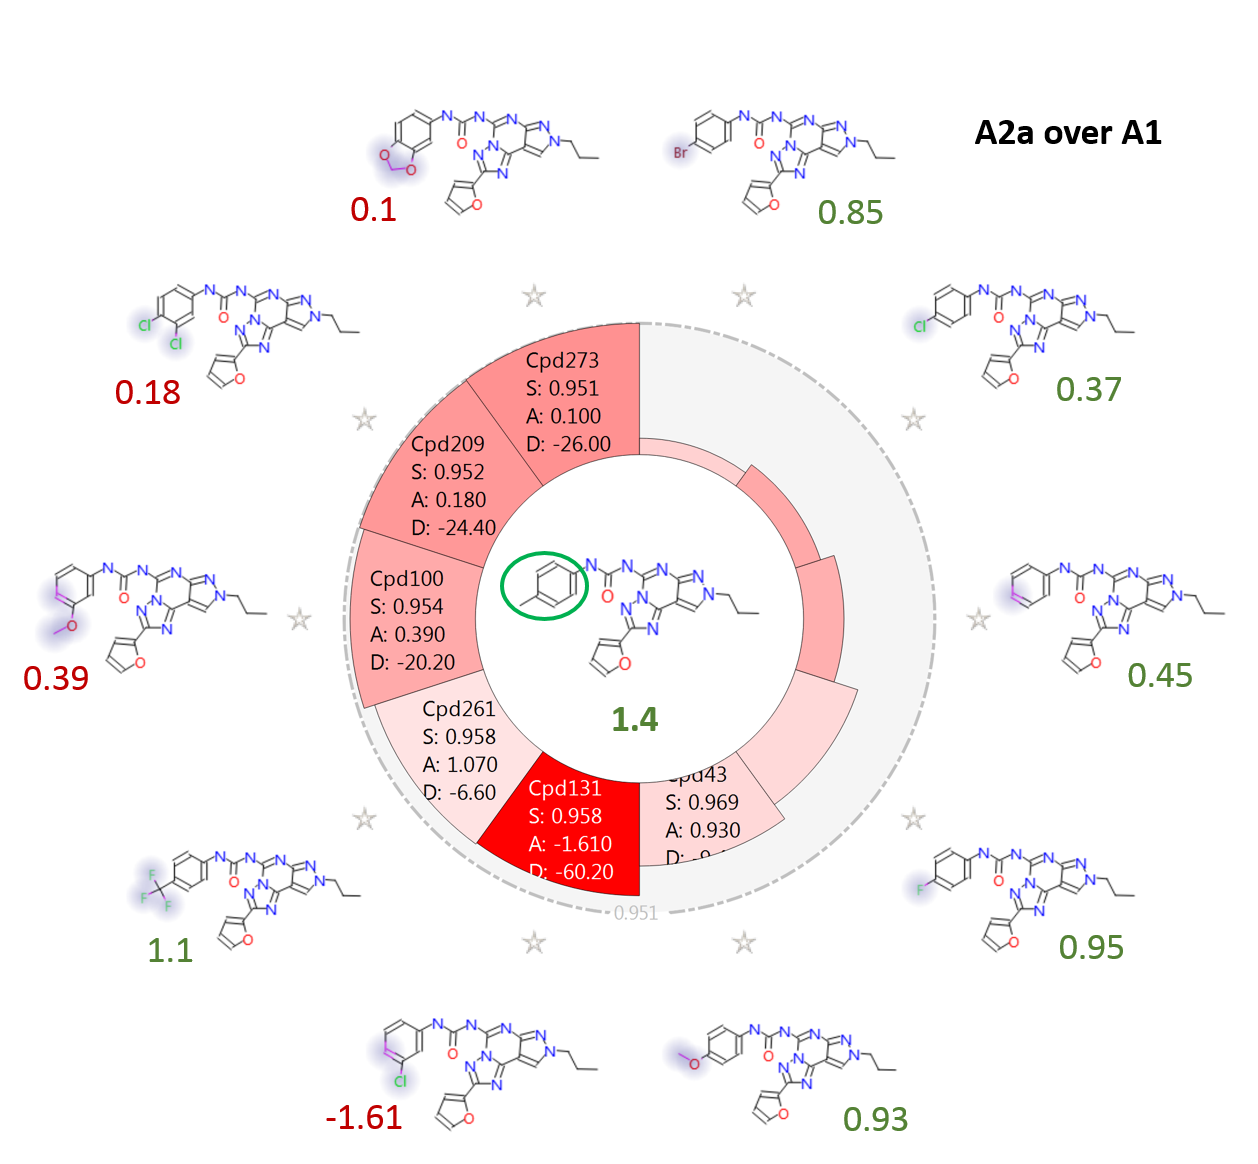
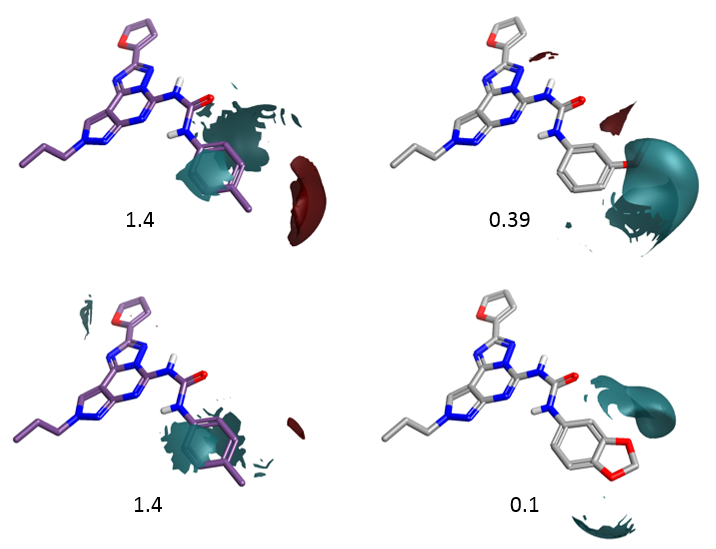
Figure 6 shows the electrostatic field differences for the p-Me compound (left) and two selected meta- and meta, para- substituted compounds. Substituents with a more negative electrostatic field surrounding the meta-position are detrimental for selectivity. This is again in agreement with the activity cliff summary analysis.
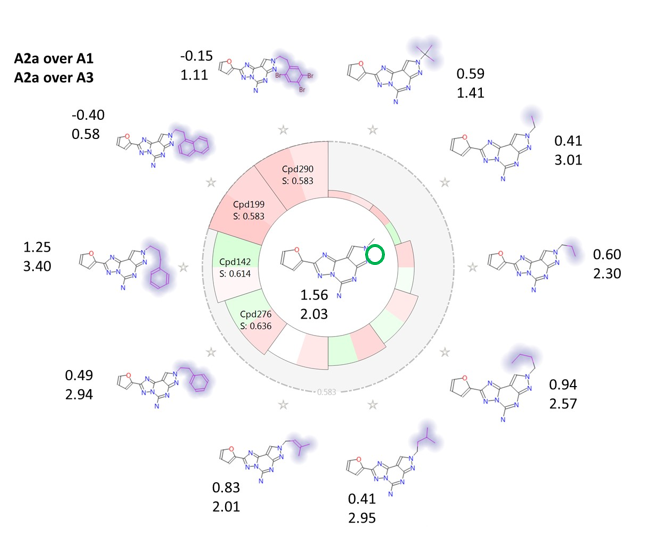
Finally, Figure 7 shows the effect on both A2a over A1 and A2a over A3 selectivity of modulating the substituents on the fused pyrazole ring. It can be seen that, again in agreement with the activity cliff summary maps, bulkier/more hydrophobic substituents have in general a detrimental effect on ‘A2a over A1’ selectivity, while up to a certain point flexible substituents with steric bulk at the end (e.g. CH2-CH2-Ph, CH2-CH2-CH2-Ph) improve ‘A2a over A3’ selectivity. Very bulky substituents, e.g. CH2-CH2-naphtyl or CH2-CH2-2,4,5-triBr-phenyl are anyway detrimental also for ‘A2a over A3’ selectivity.
Activity Atlas is a new method for summarizing the SAR for a series into a visual 3D model that can be used to inform new molecule design. Activity Atlas is particularly useful for those project teams where there is not enough SAR for a traditional 3D-QSAR approach, because it allows a qualitative analysis of large SAR tables. In this case study, activity cliff summary 3D maps were successfully applied to summarize the activity cliff data across a series of adenosine antagonists, condensing them into a simple map of the critical points in the SAR which enables the interpretation of the selectivity landscape around each compound.