Improving PROTAC properties via single-point changes to linkers
We explore how computational methods can be applied to proteolysis targeting chimera (PROTAC) design, to effectively tackle some of the ...
News
A new version of Forge, our computational chemistry workbench for ligand-based design, is now released. V10.4 includes over 170 new or improved features.
The development of our applications is guided by our customers and this release is bursting with new science and features that you have asked for. A few of these are described below, however, I suggest that you use the software for yourself to discover the other features and see the new science in action.
This new component enables you to summarize the SAR for a series into a visual 3D model that can be used to inform new molecule design. We believe it will particularly benefit those project teams where there is not enough SAR for a traditional 3D-QSAR approach.
Activity Atlas calculates and displays as 3D visualizations:
Activity Cliff Summary maps are derived from the Activity Miner module, summarizing the activity cliff data across the series into a simple map of the critical points in the SAR.
Figure 1 shows the Activity Cliff Summary for Adenosine A1, Adenosine A2a and Adenosine A3 receptor activity data for a data set of compounds published by J. Bajorath (J. Chem. Inf. Model. 51 258-266, 2011). Critical regions for SAR at the three receptors can be easily visualized and used to inform new molecule design aimed, e.g., at maintaining potency at the A1 receptors while building in selectivity towards A2 and A3.

The introduction of Activity Atlas models has led to model handling in Forge being radically overhauled so you can save, analyze and visualize multiple (Q)SAR models in the same Forge project.
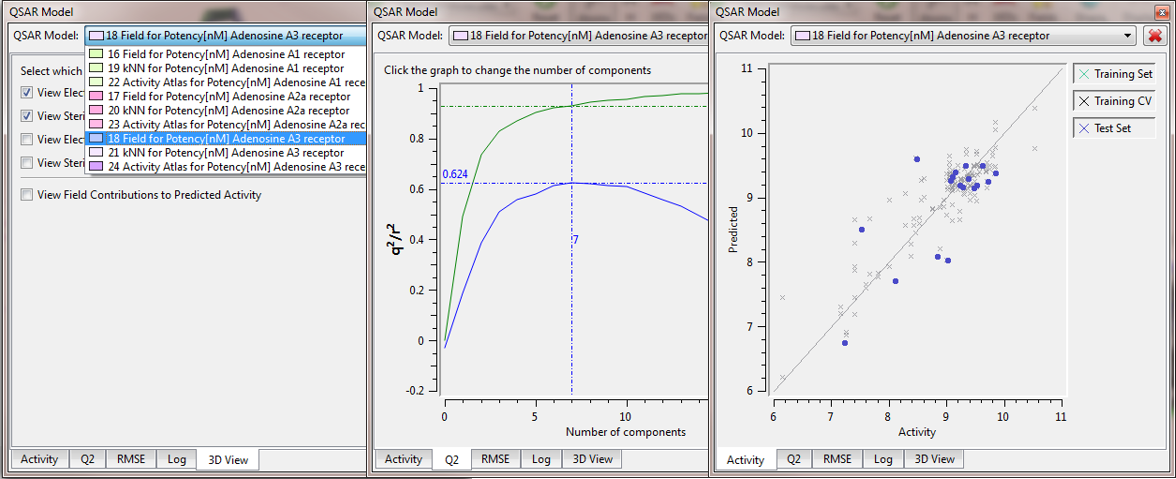
Forge now has a simple drop down box for choosing which model you wish to use or display (Figure 2). This makes it easy to compare models built against different targets or using different methods (3D-QSAR, Activity Atlas or k-Nearest Neighbours). You can now build a number of models for one or more targets and use only those with the best performance, or quickly switch between models against different activities.

Figure 2: QSAR Model Dock drop down box in Forge