Lauren Nelson†, Jenny Brookes†
†Cresset, New Cambridge House, Bassingbourn Road, Litlington, Cambridgeshire, SG8 0SS, UK.
Abstract
This case study showcases the use of Flare™ FEP1 for accurately calculating binding affinities for a dataset of 30 ligands that bind between the lipid and GPCR interface in P2Y1. In this benchmarking study, predicted affinities agree well with experimental measurements and are in line or even better with those published in the literature. The suggested workflow presented here demonstrates that careful system preparation prior to the FEP calculation, can improve results and thus reduce the number of calculations required to obtain reliable and accurate predicted binding affinities.
Introduction
Despite the improvements and increased use of alchemical relative binding free-energy (RBFE) calculations, the application of RBFE methods to membrane-bound targets such as GPCRs is under-investigated and under-tested.2 However, as reported by Yang et al.3, of the 826 known human GPCRs, roughly 350 non-olfactory members are considered druggable and 165 are validated drug targets and participate in a wide array of physiological functions. Thus, we aim to improve the modeling of these systems for use in FEP calculations. In this case study we applied Flare FEP to a large, carefully prepared GPCR system (shown in Figure 1, 35,895 atoms not including water) and achieved improved results, in terms of R2 and MUE, than those published with a competitor software in the paper by Ross et al.4 and in line with those published by Dickson et al.2
Here we use published data taken from Dickson et al.2 who investigated the GPCR, P2Y1 purinergic receptor; a class A, 7-transmembrane GPCR which was identified by Bristol-Myers Squibb for the treatment of thrombosis.5 Like other GPCR complexes, P2Y1 offers the opportunity to investigate how drugs can bind to different regions of the same GPCR and produce identical responses.6 Interestingly, as well as an extracellular binding site, P2Y1 also has a transmembrane-exposed site (on the extra-helical bundle of the P2Y1 receptor).7 This ligand binding site, between the membrane and the protein (see Figure 1) provides an interesting challenge for accurately modeling lipid interactions.
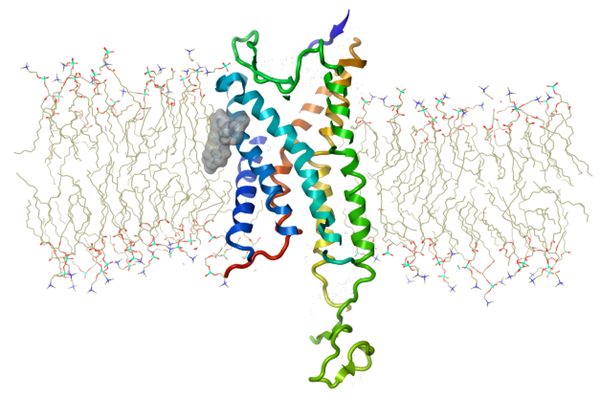 Figure 1. The crystal structure of P2Y1 (PDB: 4XNV) colored blue to red rainbow from the N terminus to C terminus, with crystallographic ligand (BPTU) shown as a hydrophobic molecular surface rendering embedded between the protein and POPC lipid bilayer. A total of 35,895 atoms are modelled excluding waters, and 93,255 atoms including the water box. This is one snapshot image which was extracted from the output of a 20ns Molecular Dynamics (MD) simulation in Flare.
To replicate the work by Dickson et al.,2 and Ross et al.,4 Flare FEP was used to predict the affinity of a 30-compound, congeneric-antagonist series with known activities, with the common substructure in Figure 2A. BPTU is the potent antagonist of P2Y1 from which this series was created, binding to the transmembrane-exposed region previously mentioned. Through careful preparation of the ligand-protein complex using MD simulations and 3D-RISM water stability analysis prior to the FEP calculations, we obtained improved predictive affinity and enhanced statistical results with respect to those published by Dickson et al.,2 thus potentially reducing the number of future subsequent alterations and FEP runs required to complete the lead optimization effort.

Figure 2. (A) The P2Y1 common antagonist substructure and (B) the crystallographic ligand of P2Y1 PDB:4XNV structure, BPTU, which was used as a reference to align the remaining 29 ligands in Flare.
Modeling GPCR-ligand complexes
BPTU (Figure 2B), is a potent antagonist of the P2Y1 GPCR system (Ki = 16 nM / ΔGbinding = -11.2 kcal/mol). Crystallographic data is available for the P2Y1-BPTU complex (PDB: 4XNV), the same as that used in the Dickson research. Their work used a dataset of 30 antagonists with measured Ki at the P2Y1 receptor, previously reported by Chao et al.5 The compounds’ activity spans 6.0 – 2000 nM, therefore providing a range of activity data covering the recommended wide dynamic range of 5 kcal/mol.8
MD Studies and 3D-RISM water analysis
As reported in a previous Flare FEP case study, we used MD and 3D-RISM water analysis to prepare the P2Y1 system. An initial MD run and water analysis step before a more extensive FEP calculation is often very useful in several regards, most importantly to gain confidence in the model’s ability to capture the bioactive ligand-protein binding mode. In this GPCR case, with the ligand binding at the protein/lipid interface, particular attention was paid to the conservation of these interactions during dynamics. Additionally, the placement of waters can be especially challenging in membrane proteins which are often thought to be largely dry. However, certain essential water molecules may exist in the molecular system, and a misplaced or absent water molecule can lead to issues and errors.
Due to the size of the system (93,255 total atoms), we conducted a 20ns MD study with a POPC lipid bilayer built around the P2Y1 receptor. The dynamics simulation used the newest available (as of writing) OpenFF 2.0 small molecule forcefield,9-10 the forcefield AMBER ff14SB for the protein,11 and a POPC lipid membrane bilayer. Calculations were ran using 298 K, NPT ensemble and a 4 fs timestep. To establish the stability of the system, the trajectory frames were analyzed, the RMSD of the ligand was checked and a later frame was selected for further preparation with 3D-RISM analysis. The dynamics trajectory showed the ligand coordinates did not deviate much from the crystallographic structure reference, and the expected interactions were maintained (no drifting from the binding site). Due to the nature of the active site under investigation (i.e., transmembrane-exposed region), extra care was taken to determine if clashes or unlikely interactions were made between the lipid bilayer and the ligand during the MD simulation.
As the ligand series was in the transmembrane-exposed region, 3D-RISM water stability analysis in Flare using Cresset XED force field12 was performed on the selected representative MD snapshot to identify any waters around this seemingly hydrophobic and enclosed active-site (Figure 3). In this way 3D-RISM may be used to identify water positions, the correct hydration at the binding site, sometimes beyond what is found in crystallographic data. This MD snapshot, with the ligands aligned to the reference (as described in the next section ‘Ligand alignment and tweaks’) and the added waters were then used as input for the Flare FEP calculations.
Including a 3D-RISM analysis step to the preparation of the system for FEP analysis enables the placing of water molecules which may have been missed or misplaced within the buried lipid-ligand-protein region during the MD preparation stage, when the lipid membrane is generated and added to the GPCR. As 3D-RISM is quick and accurate, taking only minutes on a single CPU (for a medium-sized non-membrane protein, for a very large membrane system such as this it is longer, but still a fraction of the FEP time) it is an extremely useful preparation step to avoid accuracy or stability issues with the much more compute-intensive FEP calculations.
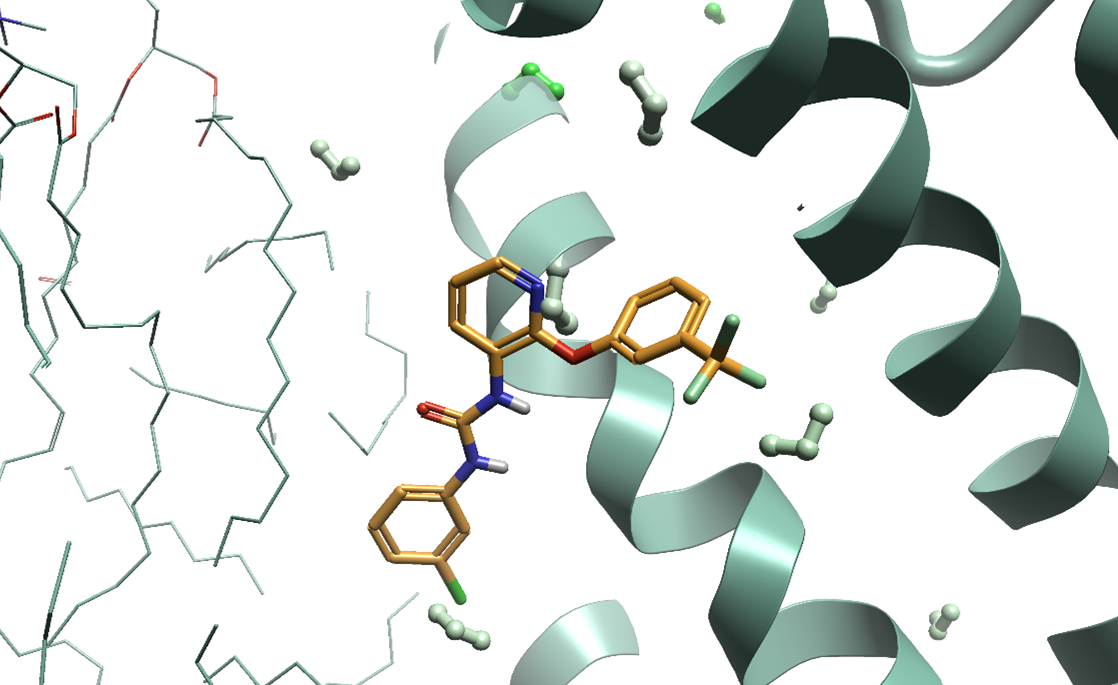
Figure 3. 3D-RISM in Flare can be used to identify bound water molecules which are not by crystallographic data, providing valuable input for Flare FEP simulations. The red to green coloring of the predicted waters corresponds to unfavorable to favorable ΔG, respectively.
Considering the uncertainty associated with atomistic input for membrane proteins, this initial preparation workflow (i.e., using dynamics and 3D-RISM) may be particularly vital to ensure the model contains all the necessary details to accurately represent the system in vivo.
Ligand alignment
The 30-ligand dataset was aligned to the ligand conformation in the selected MD snapshot using Cresset’s ligand-based alignment within Flare with the ‘Substructure’ calculation method. The ligands are aligned based on their maximum common substructure and ligand fields to provide poses for each ligand under investigation. Chiral, rotamer and tautomeric states were checked, and a close overlay generated which ultimately creates an ideal starting point for FEP calculations, as shown in Figure 4.
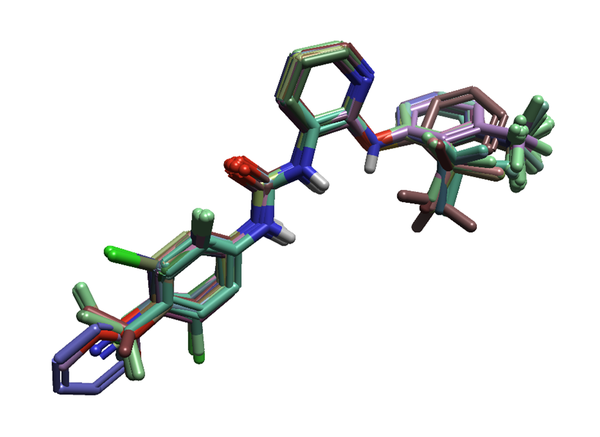 Figure 4. The 30 ligands of the P2Y1 dataset prepared and aligned in Flare.
Flare FEP calculations
Relative FEP is particularly suitable for accurately calculating the ΔGbinding for a congeneric series of ligands with small structural changes from the reference crystal molecule such as those presented in this case study, as FEP calculations are usually more reliable for small perturbations. As for the MD calculations, all Flare FEP runs reported here use the OpenFF 2.0 small molecule forcefield,9-10 the protein forcefield AMBER ff14SB,11 and a POPC lipid membrane bilayer.
This first benchmark Flare FEP run consisted of 31 ligands in total, including the 30 known active compounds and one autogenerated intermediate, as shown in Figure 5 (a ‘normal’ graph, multi-connected/with cycles). Intermediate automation in Flare FEP is a feature for improving connections in your perturbation network, ultimately positively impacting your results, without requiring any user intervention. Given the need to check for hysteresis, a graph with 90 dual-way (both directions) perturbations was created, resulting in a total of 810 Lambda windows, based on the assumption that each perturbation required the default of 9 Lambda windows. In practice, Flare FEP implements an adaptive Lambda sampling so the Lambda windows required for convergence are determined in a fully automated fashion, before the FEP calculation. Calculating perturbations in both directions contributed to a better error analysis and enhanced the overall accuracy.
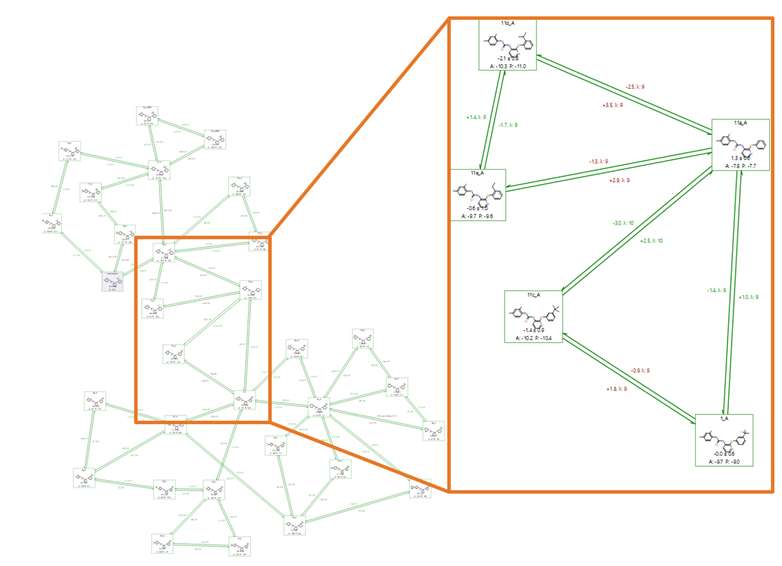
Figure 5. A completed, out-of-the-box Flare FEP benchmark run using a ‘normal’ connected map. Highlighted in the orange box are the links that join the upper and lower regions of the graph.
In this case study we also utilized a feature recently introduced in Flare, the FEP Cluster analysis tool (ligands in blue boxes of Figure 6 were identified with this tool). The new feature performs a subgraph analysis of the full Activity Plot data in a completed benchmark study to ‘cluster out’ any subgraphs with lower internal error statistics. This analysis is useful where you have at least 2 groups of molecules with different precision in the FEP predictions, or which are connected by problematic links, such that evaluating all gives you a large overestimation of error. Separating into clusters then allows the user to focus on subgroups where predictions may be more reliable as part of a smaller set and have more internal precision.
Interestingly and understandably, this ligand data set separates into two clusters that are structurally distinct. The ‘top cluster’ (in blue shown in Figure 6) is distinguished by ortho substitutions on the phenyl ring (R1, Figure 2A), whereas the ‘bottom cluster’ consists of meta substitutions (R2, Figure 2A). The two clusters are connected by links affected by hysteresis. Observing this, we aimed to improve upon the initial out-of-the-box run by adding manual intermediates to strengthen the links between the upper (top cluster, selected in blue – Figure 6) and lower portions (bottom cluster) of the first FEP benchmark. The additional manual intermediates are highlighted in Figure 6, compounds 11c_EDIT (with a meta methyl) and 11e_EDIT (with both an ortho and meta methyl). This second graph consisted of 33 ligands (with the two new additions) with 98 perturbations, and a total of 882 Lambda windows. The aim of adding the two manual intermediates as described here, was to ‘strengthen’ the connection between top and bottom of our map, so the graph is less dependent on inaccurate links with hysteresis.
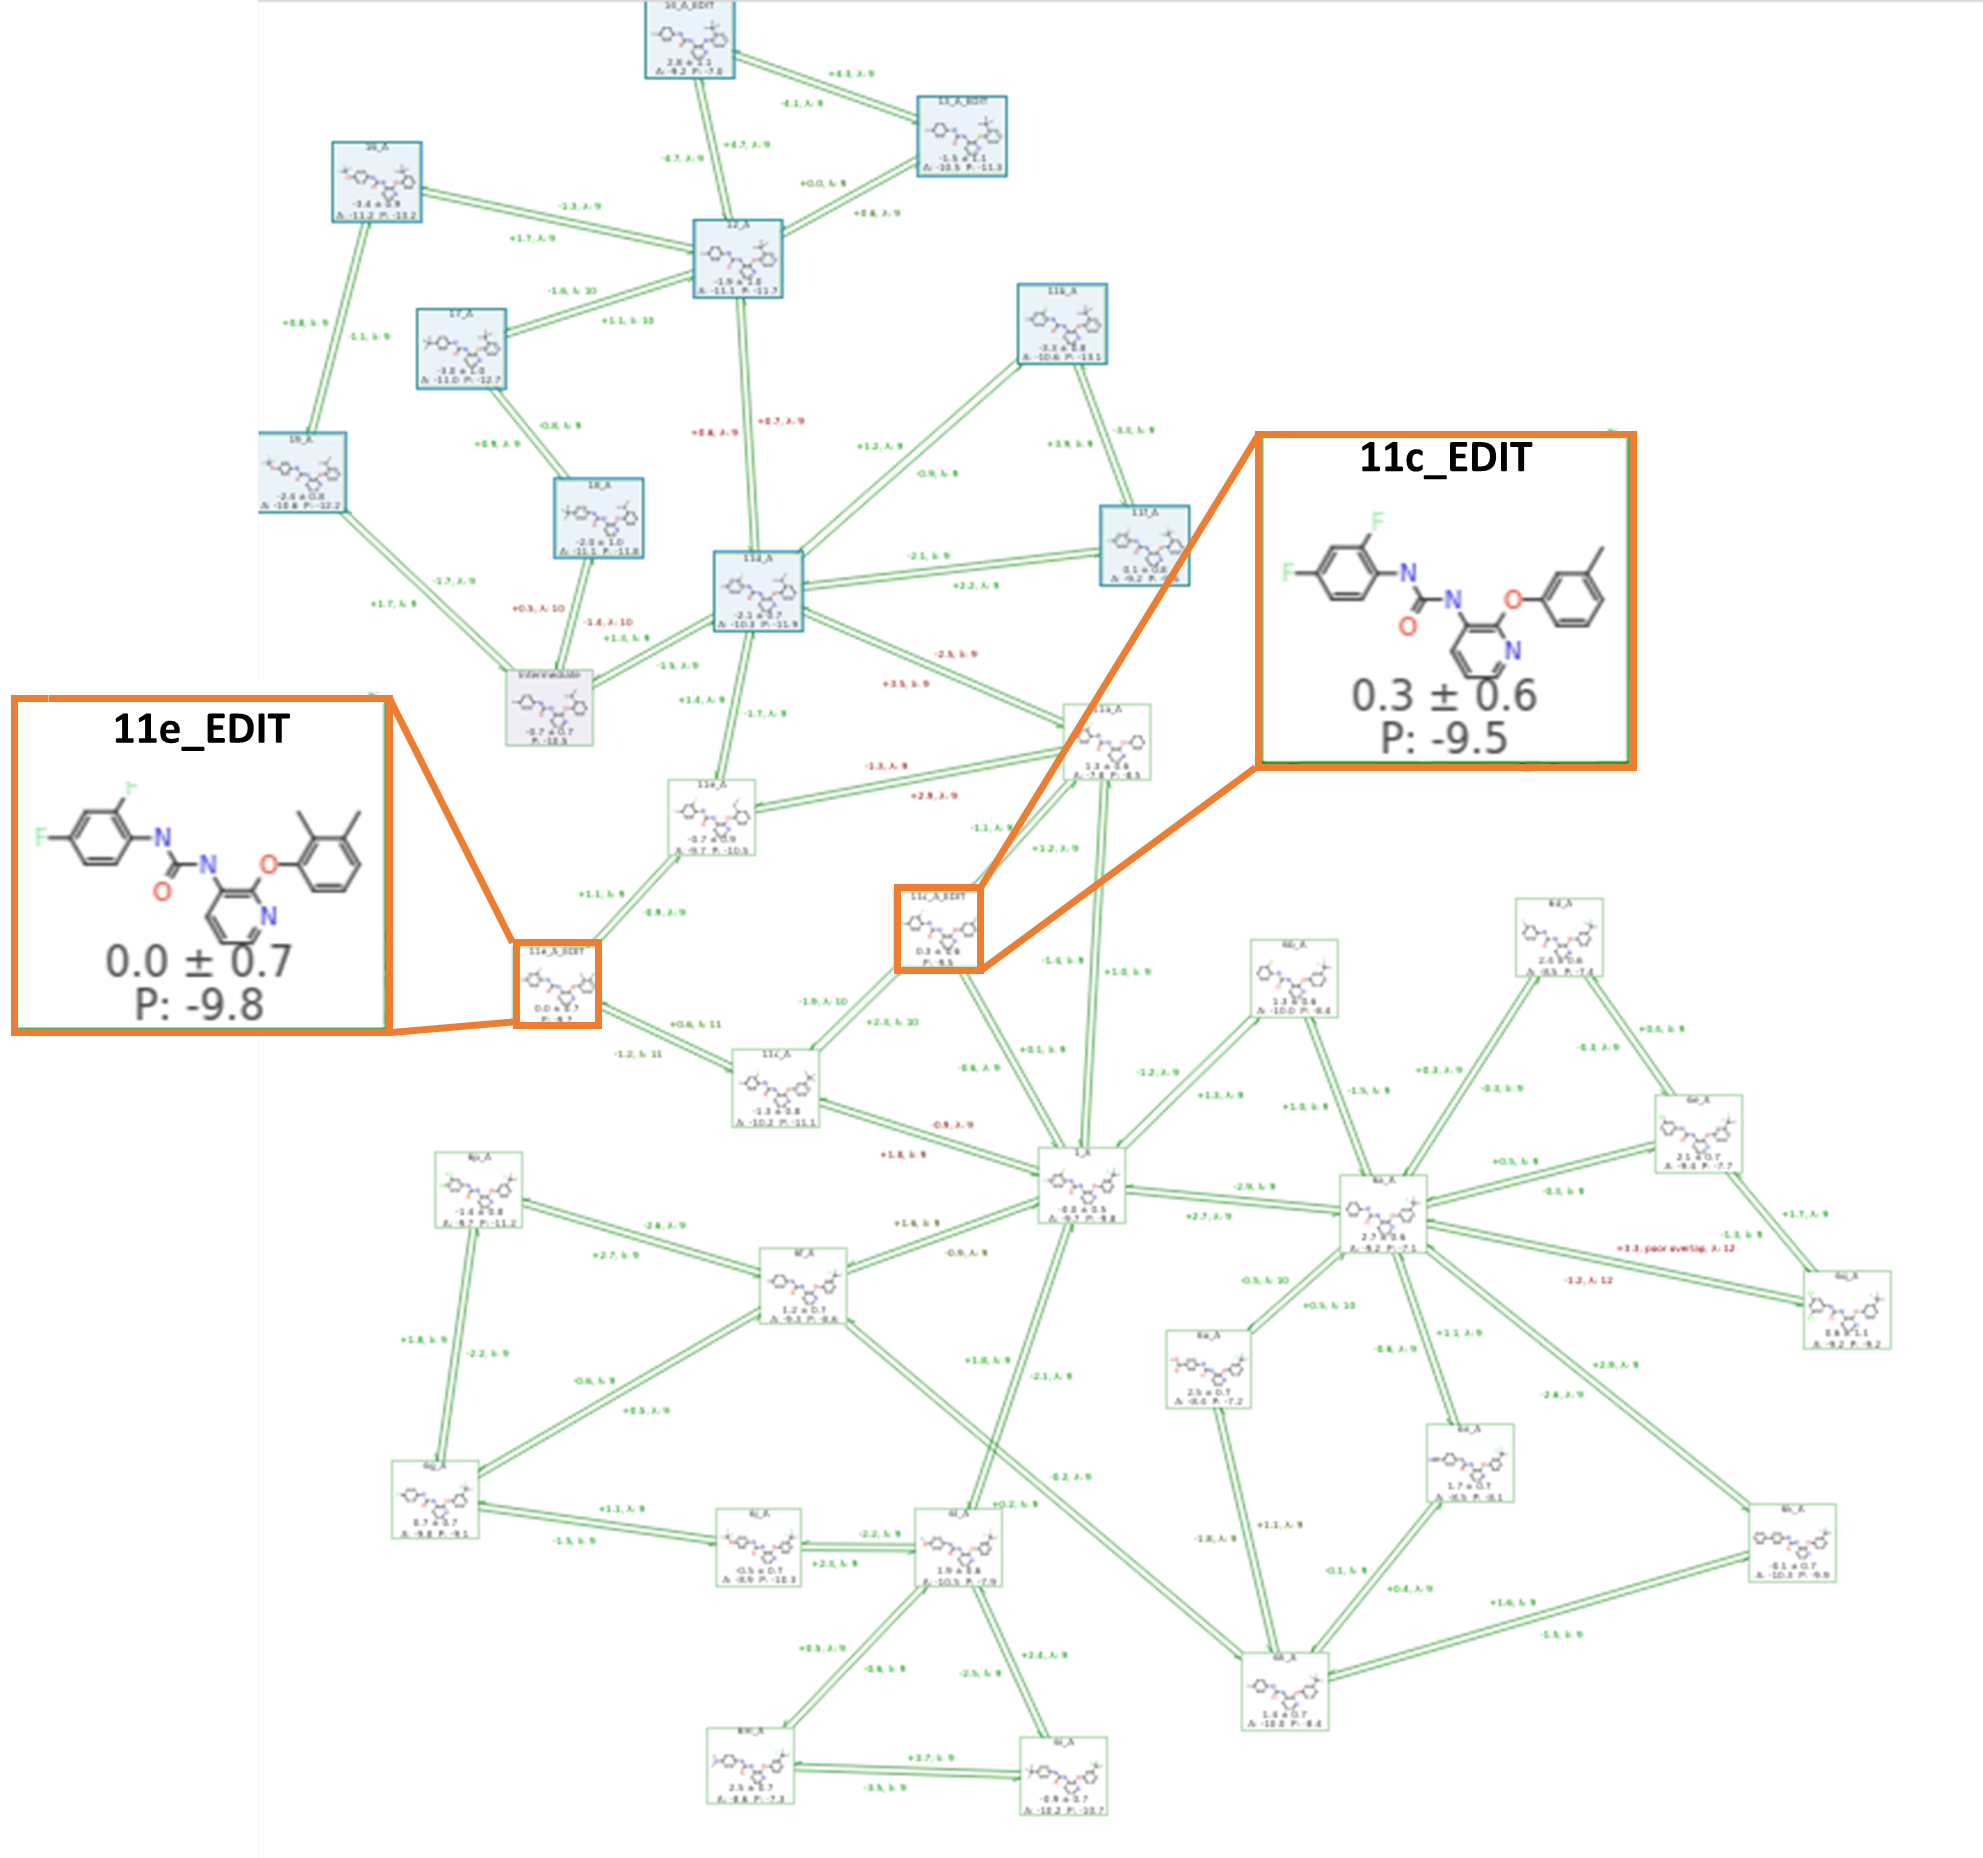 Figure 6. A completed Flare FEP benchmark run using a ‘normal’ connected map with manually added intermediates (11c_EDIT and 11e_EDIT, highlighted in orange boxes), to improve links between top and bottom clusters. The new Flare FEP clustering tool was used to highlight the top cluster of the graph in blue.
Results
Overall, Flare FEP provided good results, in line with those obtained by Dickson et al.2 and slightly better than those published by Ross et al.4 using a competitor software (see Table 1). When using Flare FEP (both with and without manually included intermediates, and without dividing the ligands into two maps as suggested by Ross et al.4), an R2 of 0.57, a MUE of 1.17 and an RMSD of 1.65 were achieved for the complete P2Y1 dataset.
Table 1. A comparison of Flare FEP statistical results on the P2Y1 dataset with published data. RMSDpw* is the root mean square deviation between the predicted and experimental ΔΔG values of all ligand pairs (pair-wise) in the dataset.
| R2 | MUE | Tau | RMSDpw* | No. of Ligands | No. of Perturbations | |
| Ross et al.4 | 0.48 | - | - | 1.41 | 30 | 76 |
| Dickson et al.2 | 0.58 | 1.29 | - | - | 30 | Estimated 70 |
| Flare FEP (out-of-the-box) | 0.57 | 1.17 | 0.56 | 1.65 | 31 | 90 |
| Flare FEP (with manual intermediates) |
0.57 | 1.18 | 0.56 | 1.67 | 33 | 98 |
The manual addition of intermediates (11c_EDIT and 11e_EDIT) to better connect the ortho and meta clusters, did not improve the statistical results. As an alternative approach, the initial map could be split into two separate maps (containing the ortho and meta substituents) to be run separately to achieve even better statistics for each group of compounds, as reported by Ross et al.4
Conclusions
This case study demonstrated that Flare FEP can accurately calculate binding affinity predictions for ligands that bind to membrane proteins, even in potentially difficult cases such as this allosteric, lipid exposed binding example, P2Y1. Overall, by applying a careful system preparation workflow consisting of preliminary MD runs, 3D-RISM water analysis, and ligand-based alignment, Flare FEP provided out-of-the-box results in line or even slightly better than those reported by previous research on the P2Y1 dataset2,4 without the need to apply an exhaustive (and computational expensive) fine-tuning of the FEP calculations.
Whilst this case study focused on a benchmark run, these results could be used to inform production runs. The good statistics found here with the complete 30 ligand data set, indicate that our model and methodology are well-calibrated and working as intended, so it is reasonable to expect that this prepared system will continue to provide good results in the production stage when used to predict the affinity of new designs. Further and finally, the fact that two ‘clusters’ of molecules were identified, allows us to adopt a more targeted and effective design strategy moving forward to the production run, focusing on better behaved designs.
References
- Flare™, version 7, Cresset®, Litlington, Cambridgeshire, UK; http://www.cresset-group.com/flare/; Cheeseright T., Mackey M., Rose S., Vinter, A.; Molecular Field Extrema as Descriptors of Biological Activity: Definition and Validation J. Chem. Inf. Model. 2006, 46 (2), 665-676; Bauer M. R., Mackey M. D.; Electrostatic Complementarity as a Fast and Effective Tool to Optimize Binding and Selectivity of Protein–Ligand Complexes J. Med. Chem. 2019, 62, 6, 3036-3050; Maximilian Kuhn, Stuart Firth-Clark, Paolo Tosco, Antonia S. J. S. Mey, Mark Mackey and Julien Michel Assessment of Binding Affinity via Alchemical Free-Energy Calculations J. Chem. Inf. Model. 2020, 60, 6, 3120–3130
- Dickson, C., Hornak, V., and Duca, J. Relative Binding Free-Energy Calculations at Lipid-Exposed Sites: Deciphering Hot Spots, Journal of Chemical Information and Modeling. 2021 61 (12), 5923-5930 DOI: 10.1021/acs.jcim.1c01147
- Yang, D., et al. G protein-coupled receptors: structure- and function-based drug discovery. Signal Transduction and Targeted Therapy. 2021, 6, 7. DOI: 10.1038/s41392-020-00435-w
- Ross, G. et al. The maximal and current accuracy of rigorous protein-ligand binding free energy calculations. ChemRxiv. Cambridge: Cambridge Open Engage; 2022; This content is a preprint and has not been peer-reviewed.
- Chao, H.; et al. Discovery of 2-(Phenoxypyridine)-3-phenylureas as Small Molecule P2Y1 Antagonists. Journal of Medicinal Chemistry. 2013, 56, 1704−1714.
- Yuan. S; et al. The Molecular Mechanism of P2Y1 Receptor Activation. Angewandte Chemie (International Ed. In English). 2016, 55(35), 10331-10335. DOI: 10.1002/anie.201605147.
- Mañé. N, Jiménez-Sábado. V, Jiménez. M. BPTU, an allosteric antagonist of P2Y1 receptor, blocks nerve mediated inhibitory neuromuscular responses in the gastrointestinal tract of rodents. Neuropharmacology. 2016, 110, 376-385. DOI: 10.1016/j.neuropharm.2016.07.033.
- Hahn, D. et al.; Best Practices for Constructing, Preparing, and Evaluating Protein-Ligand Binding Affinity Benchmarks [Article v1.0]. Living Journal of Computational Molecular Science. 2022, 4 (1), 1497. DOI: 10.33011/livecoms.4.1.1497
- Qui Y. et al. Development and Benchmarking of Open Force Field v1.0.0-the Parsley Small-Molecule Force Field. Journal of Chemical Theory and Computation. 2021, 17 (10), 6262-6280. DOI: 10.1021/acs.jctc.1c00571
- Wagner J. et al. openforcefield/openff-forcefields: Version 2.0.0 "Sage" (2.0.0). 2021. DOI: 10.5281/zenodo.5214478
- Maier, J. et al. ff14SB: Improving the Accuracy of Protein Side Chain and Backbone Parameters from ff99SB. Journal of Chemical Theory and Computation. 2015, 11, 8, 3696-3713 DOI: 10.1021/acs.jctc.5b00255
- Vinter, J. Computer-Aided Molecular Design, 1994, 8, 653-668